

NetSol Technologies Limited (PSX: NETSOL) was incorporated in Pakistan as a private limited company in 1996 and was later converted into a public limited company. The company is engaged in the development and sale of computer software and allied services locally as well as internationally.
Pattern of Shareholding
As of June 30, 2025, NETSOL has a total of 85.147 million shares outstanding which are held by 8869 shareholders. NetSol Technologies Inc., the holding company of NETSOL, has the majority stake of 69.76 percent in the company followed by local general public holding 22.34 percent shares. Public sector companies account for 5.69 percent of the outstanding shares of NETSOL. Around 1.49 percent of the company’s shares are held by its directors, CEO, their spouse and minor children. The remaining shares are held by other categories of shareholders.
Historical Performance (2019-25)
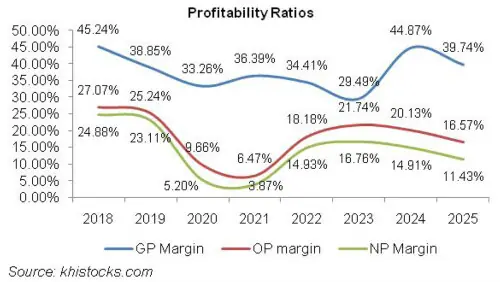
Except for a year-on-year decline in 2020 and 2025, NETSOL’s topline rode an upward trajectory over the period under consideration. Its bottomline shrank in 2020, 2021 and 2025. NETSOL’s gross profit margin which had been dropping until 2020 showed improvement in 2021 only to slide back in 2022 and 2023.
In 2024, gross margin posted a staggering growth followed by a downtick in 2025. Conversely, operating and net margins kept dipping until 2021 and recovered in 2022 and 2023. In the subsequent years, NETSOL’s operating and net margins considerably diluted. The detailed performance of the period under consideration is given below.
In 2019, NETSOL’s topline grew by 25.59 percent year-on-year to clock in at Rs.5381.20 million. This came on the back of global implementation of its flagship product NFS Ascent. The company also finalized contracts with leading blue-chip organizations locally and globally in 2019. The implementation of NFS Ascent in China was the largest implementation of NETSOL to date.
As of 2019, 99.8 percent of NETSOL’s total revenue was from the international market. Cost of revenue jacked up by 40.25 percent year-on-year in 2019 which largely included payroll expense followed by travelling and conveyance charges. While gross profit grew by 7.85 percent year-on-year in 2019, GP margin plummeted from 45.24 percent in 2018 to 38.85 percent in 2019.
NETSOL’s distribution expense grew by 17 percent year-on-year in 2019 while its administrative expense inched up by 1 percent. The main growth propellers in the operating expense category were salaries and benefits as well as R&D expense. The company recorded tremendous 75.93 percent year-on-year growth in its other income on account of exchange gain as it drives its major revenue from foreign markets. Other expense drastically grew from Rs.4.30 million in 2018 to Rs.261.83 million in 2019, signifying a jump of around 5983.46 percent on account R&D cost. While operating profit grew by 17.10 percent year-on-year in 2019, OP margin dropped from 27 percent in 2018 to 25.24 percent in 2019. The company generally financed its operations through equity finances which is evident from the fact that its finance cost as a percentage of its topline stayed under 5 percent in all the years under consideration.
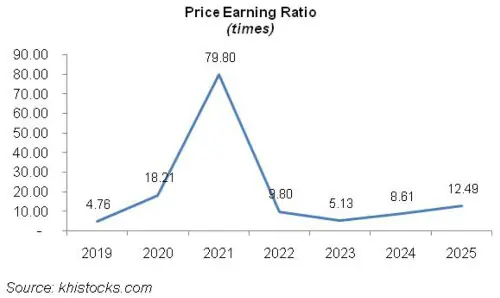
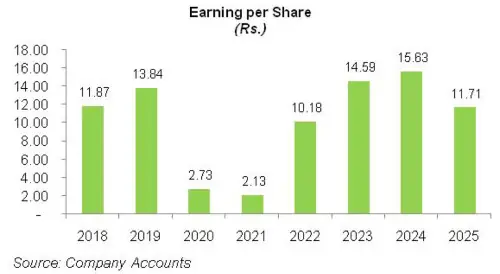
NETSOL’s debt-to-equity ratio stood at 16.8 percent in 2019. Finance cost shrank by 9.66 percent in 2019. Its bottomline grew by 16.65 percent year-on-year in 2019 to clock in at Rs.1243.48 million with NP margin of 23.11 percent versus NP margin of 24.88 percent posted in 2018. EPS also grew Rs.11.87 in 2018 to Rs.13.84 in 2019.
In 2020, NETSOL’s topline shrank by 12.5 percent year-on-year to clock in at Rs.4708.37 million. The company achieved major milestones in 2020 which included a major American multinational automaker which went live in China with NFS Ascent’s Retail Platform. Besides, the company also deployed its NFS Ascent in Hongkong and Malaysia for a leading German auto captive. However, the drop in sales came on account of on-site services which came to a standstill on the back of COVID-19 related lockdowns and travel restrictions. Cost of sales also shrank by 4.5 percent year-on-year mainly on account of a drop in travel and conveyance charges.
Gross profit for 2020 plunged by 25.10 percent year-on-year with GP margin sliding down to 33.26 percent. Distribution expense dropped by 32 percent year-on-year in 2020 on the back of a considerable drop in commission on sales.
There was a drop in signing on new deals with the customers in 2020 as majority of customers were in their maintenance phase after successful implementation in the previous years. This is also evident from a drop in license fee in 2020 while maintenance fee grew by a good momentum.
Administrative expense ticked up by 2.88 percent in 2020 due to higher payroll expense. Other income dropped by 49 percent year-on-year in 2020 due to 90 percent drop in exchange gain on the back of a huge decline in export revenue. This was partially offset by handsome dividend income from M/S Netsol Innovation (Private) Limited.
Other expense grew by 15.56 percent year-on-year in 2020 as while R&D expense dropped, the company booked huge provision against doubtful debts in 2020. Operating profit shriveled by 66.52 percent year-on-year in 2020 with OP margin falling down to 9.66percent. Finance cost grew by 21.94 percent year-on-year in 2020 due to increase in short-term and long-term financing in 2020 as the company availed the SBP Refinance Scheme for the payment of salaries and wages. This increased NETSOL’s debt-to-equity ratio to 24 percent in 2020. In 2020, the company also recorded a share of loss of an associate company worth Rs. 66.79 million. Consequently, bottomline crashed by 80.31 percent year-on-year in 2020 to clock in at Rs.244.84 million with NP margin of 5.2 percent. EPS also posted a steep fall to stand at Rs.2.73 in 2020.
In 2021, NETSOL’s topline posted a marginal 5 percent year-on-year growth to clock in at Rs.4947.56 million. The license revenue mainly came on the back of provision of license to the sister concern’s client for the deployment of NFS Ascent in China and Thailand. Besides, there was a regular stream of customization and enhancement requests from the existing clientele which boosted the maintenance fee in 2021. During 2021, the company didn’t make any local revenue. The cost of sales remained almost the same as it was in the previous year. This drove gross profit up by 14.97 percent year-on-year in 2021 with a slight improvement in GP margin which clocked in at 36.40 percent. Distribution expense grew by 20.28 percent year-on-year in 2021 primarily due to a rise in commission on sales.
Administrative expense shrank by 1 percent year-on-year in 2021. While payroll expense significantly rose in 2021, the drop in administrative expense came on the back of a plunge in travelling and conveyance and entertainment expense. Rent, rates and taxes also contributed to a drop in administrative expense as short-term leases dropped during the year. Other income dropped by a massive 68.48 percent year-on-year in 2021 as the company didn’t receive any dividend income. Furthermore, there was no exchange gain as the year ended with a stronger Pak Rupee. Other expense also contracted by 1.79 percent year-on-year. While the company incurred a massive exchange loss of Rs. 119.655 million in 2021 as against exchange gain of Rs.83.461 million in the previous year, the drop in other expense in 2021 was on account of a drop in R&D cost as well as lesser provision booked for expected credit losses. Higher distribution expense coupled with thin other income culminated into 29.63 percent year-on-year drop in operating profitwith OP margin tapering off to 6.47 percent in 2021.
Finance cost grew by 21.33 percent year-on-year in 2021 despite lower discount rate during the year. This was due to increase in short-term borrowings under export refinance scheme. NETSOL’s debt-to-equity ratio grew to 26 percent in 2021. The share of loss of an associate company reduced by 59 percent year-on-year in 2021 yet net profit tapered by 21.75 percent year-on-year to clock in at Rs.191.59 million. NP margin clocked in at 3.87 percent in 2021 – the lowest among all the years under consideration. EPS also inched down to Rs.2.13 in 2021.
2022 proved to be the most fortunate year for NETSOL as not only did its topline grew by 23.63 percent year-on-year to clock in at Rs. 6116.64 million but its bottomlinealso expanded exponentially during the year. The sales growth was on account of the implementation of NFS Ascent at various destinations in Japan, Australia, South Africa and Taiwan which increased its license revenue. Maintenance revenue also grew remarkably during the year while there was a drop in services revenue. The company also made revenue from local market in 2022. The cost of sales inched up 27.47 percent year-on-year in 2022 due to higher payroll expense, software license charges, travel and conveyance charges as well as depreciation expense incurred during the year. This culminated into a drop in GP margin to 34.41 percent in 2022 although gross profit grew by 16.92 percent year-on-year during the year. Distribution expense grew by a marginal 4 percent in 2022.
While salaries expense grew considerably in 2022, the drop in commission on sales diluted the growth in distribution expense. Administrative expense grew by 28.64percent year-on-year in 2022. What made an astounding contribution in the bottomline growth in 2022 was a marvelous 607 percent growth in other income on account of a substantial exchange gain worth Rs.790.317 million. Other expense grew by 18.64 percent year-on-year due to higher R&D cost and higher provision for expected credit losses. NETSOL’s operating profit magnified by 247.52 percent year-on-year in 2022 with OP margin climbing up to 18.18 percent. Finance cost grew by a mere 0.55 percent in 2022 despite multiple rounds of monetary tightening. This was due to lesser outstanding borrowings at the end of 2022 which pushed down NETSOL’s debt-to-equity to 23 percent in 2022. Although share of loss of an associate company grew by 509.14 percent in 2022 yet the company was able to report 376.66 percent year-on-year rise in its bottomline which clocked in at Rs.913.22 million in 2022 with NP margin of 14.93 percent. EPS ticked up to Rs.10.18 in 2022.
The lucky streak continued in 2023 as NETSOL posted year-on-year growth of 25.40 percent in its topline which was recorded at Rs.7670.18 million. While local revenue posted a plunge in 2023 on account of deprived revenue from license, export sales continued to outshine the previous year. In the export category too, license revenue fell and the growth was led by revenue emanating from subscription and support as well as services segments. During the year, NFS Ascent was rolled out in the Northern Europe. Besides, the company also launched a number of new products &services, the most prominent was Flex, which is the API based calculation engine for credit, finance and leasing industry. Cost of sales multiplied by 34.81 percent in 2023 mainly on account of higher payroll expense, software licenses as well as travelling & conveyance expenses incurred during the year. Gross profit ticked up by 7.47 percent in 2023, however, GP margin slid to its lowest level of 29.49 percent. Selling & distribution expense multiplied by 17.54 percent in 2023 while administrative expense surged by 38.83 percent. The main growth propellers of operating expense were salaries & benefits, sales commission as well as travelling & conveyance. It is to be noted that NETSOL right-sized its workforce as the company was in the process of becoming a SaaS-based entity. Other expense mounted by 55.22 percent in 2023 due to higher R&D cost and elevated provisioning for ECL. Other income picked up by 87.69 percent in 2023 mainly on account of hefty gains recorded on foreign currency translation. Operating profit strengthened by 50 percent in 2023 with OP margin climbing up to 21.75 percent. Finance cost surged by 221.66 percent in 2023 on account of monetary tightening. Net profit improved by 40.74 percent to clock in at Rs.1285.23 million in 2023 with EPS of Rs.14.59 and NP margin of 16.76 percent.
In 2024, NETSOL was able to drive its revenue up by 21 percent to clock in at Rs.9280.65 million. This was primarily backed by higher export sales. During the year, a number of existing customers subscribed to the newly launched Appex Now products. Furthermore, the company achieved Advance Tier Partner Status with Amazon Web Services (AWS). The calculation engine “Flex” also got traction during the year. Subscription & support revenue enhanced by 22 percent to clock in at Rs.4697 million in 2024.The company made a tremendous license sale of Rs. 802 million to its associated companies. Services revenue increased by 11 percent to clock in at Rs. 3781 million on account of enhancement and customization of the systems deployed at the customer sites.Despite all the developments, NETSOL was able to cut down its cost by 5.39 percent in 2024 by implementing cost optimization measures particularly streamlining of its workforce in line with global structural changes. Gross profit built up by 84 percent in 2024with GP margin climbing up to highest level since 2019. Selling & distribution expense mounted by 27.71 percent in 2024 due to higher salaries of sales force, greater commission on sales as well as elevated travelling & conveyance charges. Administrative expense ticked up by 4.68 percent in 2024 due to higher payroll expense. This was despite the fact that the company streamlined its workforce from 1441 employees in 2023 to 1136 employees in 2024. Other expense escalated by 26.61 percent during 2024 on account of exchange loss of Rs.325.56 million incurred during the year due to appreciation in the value of Pak Rupee. Other income fell by 66.54 percent in 2024 as the company didn’t record any translation gain on foreign currency translation due to stable Pak Rupee. NETSOL’s operating profit inched up by 12 percent in 2024 with OP margin ticking down to 20.13 percent. Finance cost surged by 64.83 percent in 2024 due to higher discount rate. Net profit inched up by 7.70 percent to clock in at Rs.1384.159 million with EPS of Rs.15.63 and NP margin of 14.91 percent.
In 2025, NETSOL recorded 2.82 percent year-on-year decline in its net revenue which clocked in at Rs.9018.96 million. Both local and export sales dropped during the year as the company recorded a petite license revenue in 2025 due to transitioning from traditional license based model to SaaS model. During the year, the company formally launched its AI operations – from the formal launch of AI powered Transcend Platform to the integration of AI in all its systems. Services revenue also plunged both in the local and export markets. Conversely, subscription & support revenue dipped in local market while grew in the export market. As many customers entered the maintenance phase after successful implementation of projects, cost of sales inched up by 6.22 percent in 2025. This resulted in 13.93 percent diminution in gross profit in 2025 with GP margin falling down to 39.74 percent. Distribution expense remained largely intact at the last year level as higher payroll expense and travelling expense was offset by lower commission on sales recorded during the year. Administrative expense inched up by a paltry 1.10 percent in 2025 primarily due to higher payroll expense. The company expanded its workforce from 1136 employees in 2024 to 1172 employees in 2025. Other expense dipped by 8.28 percent in 2025 as no exchange loss was incurred during the year. Conversely, exchange gain of Rs. 313.273 million due to depreciation of Pak Rupee resulted in 24.23 percent enhancement in other income in 2025. Operating profit diminished by 20 percent in 2025 with OP margin sliding down to 16.57 percent. Monetary easing resulted in 27.43 percent plunge in finance cost in 2025. This was despite the fact that the company’s outstanding borrowings considerably increased during the year. Net profit deteriorated by 25.52 percent to clock in Rs.1030.927 million in 2025. This translated into EPS of Rs.11.71 and NP margin of 11.43 percent in 2025.
Recent Performance (9MFY26)
During the nine-month period of the ongoing fiscal year, NETSOL posted a staggering 22.38 percent year-on-year growth in its topline which clocked in at Rs.7882.478 million. While local revenue continued to slide, export revenue posted a phenomenal 22.71 percent year-on-year growth to clock in at Rs.7851.746 million. This came on the back of robust license revenue of Rs.1272.546 million recognized from the current customers during the period. Subscription & support revenue also increased by 8.18 percent to clock in at Rs.4240.87 million as many customers were transitioning to the maintenance phase following project execution. Cost of sales ticked up by 6.86 percent in 9MFY26 due to efficient cost control measures put in place by the company. This resulted in 47.74 percent stronger gross profit in 9MFY26 with GP margin clocking in at 45.83 percent versus GP margin of 37.96 percent recorded in 9MFY25. Distribution expense and administrative expense mounted by 18.30 percent and 6.11 percent respectively during 9MFY26 due to enhance operations across borders. Other expense tapered off by 44.34 percent in 9MFY26 likely due to lower provisioning of ECL and lower R&D cost. Other income also shrank by 47.19 percent in 9MFY26 as higher profit on bank deposits, interest income from related parties and gain on the disposal of fixed assets was offset by considerably thinner profit on short-term investments due to lower discount rate. NETSOL posted 138 percent stronger operating profit in 9MFY26 with OP margin of 21.58 percent versus OP margin of 11.10 percent recorded in 9MFY25. Finance cost contracted by 25.52 percent in 9MFY26 due to monetary easing. This was despite greater outstanding liabilities at the end of the period. Net profit mounted by 301.87 percent to clock in at Rs.1394.29 million in 9MFY26. This translated into EPS of Rs.16.03 in 9MFY26 versus EPS of Rs.3.92 registered in 9MFY25. NP margin also strengthened from 5.39 percent in 9MFY25 to 17.69 percent in 9MFY26.
Future Outlook
NETSOL is expected to post robust sales in the coming times as it continues to stretch its wings in the new geographical markets as well as launch new product offerings by leveraging emerging technologies such as AI. The company is also targeting tier-2 and tier-3 companies by offering affordable and tailored technology solutions. Transcend Finance and Transcend Retail will continue to be at the heart of the company’s ongoing AI driven programs. These core programs will be complimented by Transcend Marketplace, AI labs and consultancy services to provide comprehensive solutions to financial services and automotive industries. Cost optimization measures will further aid the company’s financial performance.


Comments