

Sitara Chemical Industries Limited (PSX: SITC) was incorporated in Pakistan as a public limited company in 1981. The company is engaged in operating a Chlor Alkali plant, Oleo Chemical plant and a yarn spinning unit.
Pattern of Shareholding
As of June 30, 2025, SITC has a total of 21.429 million shares outstanding which were held by 1805 diverse shareholders. Directors, CEO, their spouse and minor children have the majority stake of around 64.15 percent in the company followed by local general public accounting for 10.76 percent shares.
Banks, DFIs and NBFIs hold 10.25 percent shares of the company while associated companies, undertakings and related parties hold 4.49 percent shares. Around 2.97 percent of SITC’s shares are held by mutual funds and 2.31 percent by joint stock companies.
The remaining ownership is distributed among other categories of shareholders.
Financial Performance (2019-25)
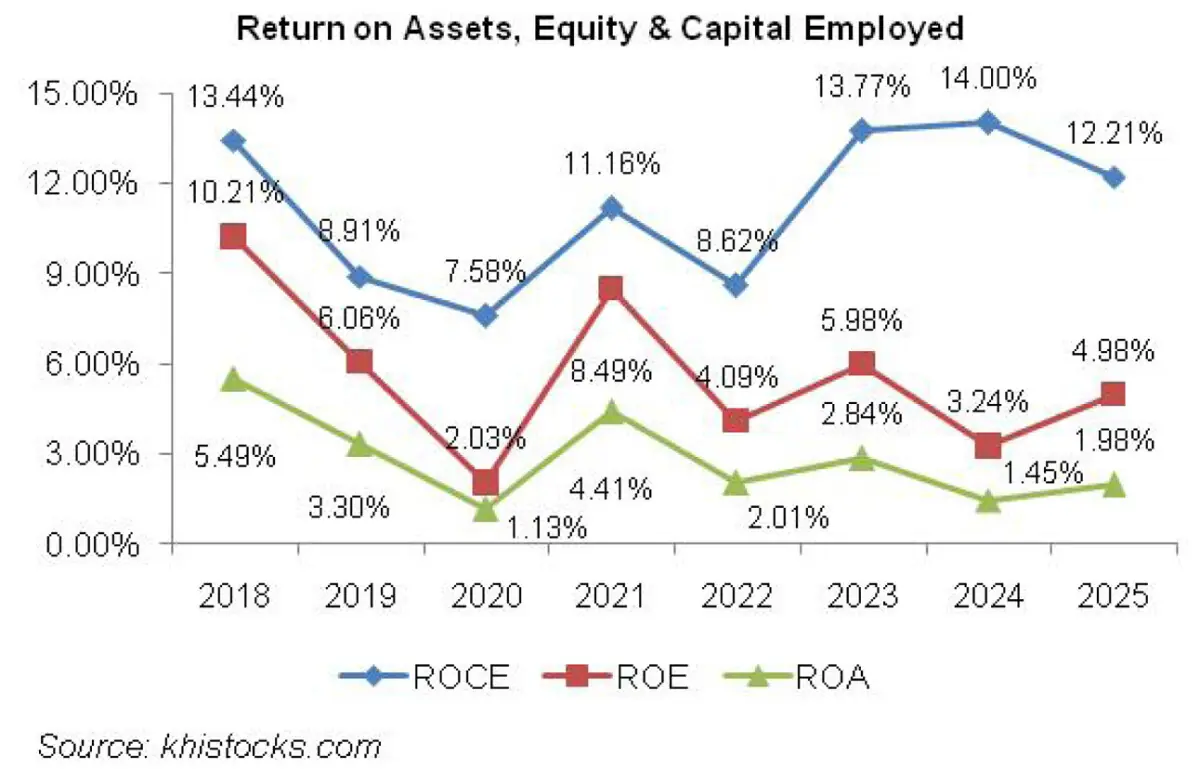
Barring a marginal year-on-year dip in 2020, SITC’s topline followed an inclining trend over the period under consideration. Conversely, its bottomline couldn’t follow the suit and grew only in 2021, 2023 and 2025. SITC’s margins fluctuated since 2019 to peak in 2021. In 2022, SITC’s margins shrank followed by a rebound in 2023.
The same pattern of fall and rise continued in 2024 and 2025 (see the graph of profitability ratios). The detailed performance overview of the period under consideration is given below.
In 2019, SITC’s topline grew by 3.53 percent year-on-year to clock in at Rs.12,698.11 million. During the year, overall economic environment remained stressed with a downtick in GDP and LSM growth.
Owing to demand destruction, the company’s production and sales volume dropped across various product categories. The uptick in net sales can be attributed to upward revision in the prices of Caustic Soda - the main revenue driver of SITC.
Cost of sales grew by 3.18 percent year-on-year in 2019 on account of a hike in inflation, Pak Rupee depreciation as well as spike in energy tariff during the year. Gross profit inched up by 4.82 percent year-on-year in 2019 with a slight change in GP margin from 21.47 percent in 2018 to 21.73 percent in 2019.
During the year, SITC overhauled its electrolyzer and replacement of old machinery with new Swiss machinery in the textile division which resulted in cost efficiency in terms of electricity savings and also drove up the production capacity of SITC by 20 MTPD. On account of increased prices of petroleum, freight charges greatly escalated during the year, pushing up the distribution expense by 27.57 percent year-on-year in 2019.
Despite a drop in the HR count from 2327 in 2018 to 2172 in 2019, payroll expense continued to elevate on account of inflation. This drove up the administrative expense by 11.89 percent year-on-year in 2019. SITC incurred net other expense of Rs.23.81 million in 2019, up 400.72 percent year-on-year on account of loss incurred on the disposal of fixed assets in 2019. All these factors squeezed the operating profit by 2.56 percent year-on-year in 2019 with OP margin marching down to 13.44 percent from 14.28 percent in 2018. Finance cost spiked by 46 percent year-on-year not only because of high discount rate but also because of increased borrowings to finance the capital expenditure during the year.
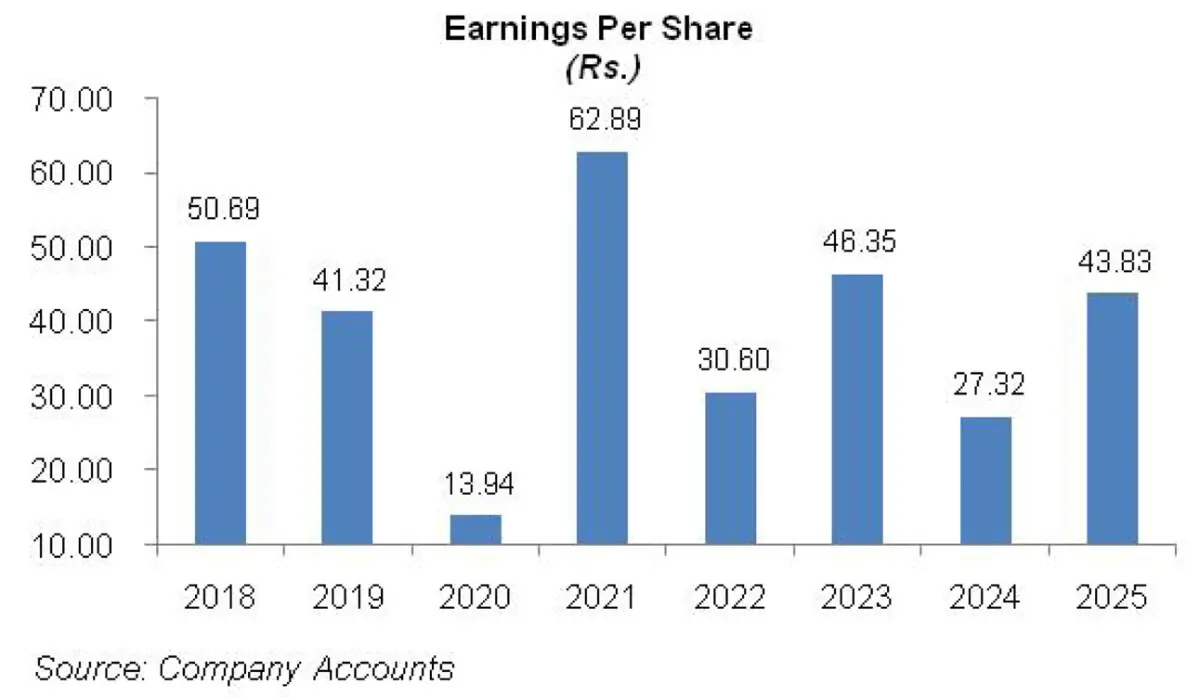
Net profit slid by 18.48 percent year-on-year in 2019 to clock in at Rs.885.46 million with NP margin of 6.97 percent versus NP margin of 8.86 percent recorded in 2018. EPS also tapered from Rs.50.69 in 2018 to Rs.41.32 in 2019.
The economic woes further spiraled in 2020 with the outbreak of COVID-19. This resulted in the lockdown in the 4QFY20, which created a decline of 0.38 percent in GDP and 10.12 percent in LSM growth. The shutdown of industries further constricted the demand of SITC’s products, resulting in 7.13 percent year-on-year shrinkage in its topline which clocked in at Rs.11,792.67 million in 2020. Cost of sales dipped by 4.28 percent year-on-year in 2020. Despite the BMR projects undertaken last year, which were expected to fully materialize in 2020, hike in electricity, RLNG, coal and cotton bale prices reduced the gross profit by 17.41 percent year-on-year in 2020 with GP margin slipping to 19.33 percent in 2020.
Another major reason for high cost of sales was a switch from combination of natural gas and RLNG to only RLNG in 2020. Lower sales resulted in low freight charges. This coupled with considerably lower advertisement budget allocated for the year pushed the distribution expense down by 7.38 percent year-on-year in 2020. Number of employees dropped to 2123 in 2020 which slightly reduced the payroll expense. This coupled with electricity savings on account of lockdown translated into 5.14 percent dive in administrative expense in 2020. SITC registered net other income of Rs.97.10 million in 2020 which was primarily the result of lower provisioning done for WWF and WPPF in 2020. Moreover, unwinding of deferred consideration receivable and higher dividend income on investments also contributed in recording net other income in 2020 versus net other expense recorded in the previous year.
Operating profit plummeted by 17.70 percent year-on-year in 2020 with OP margin sliding down to 11.91 percent. Finance cost magnified by 55 percent year-on-year in 2020 due to high discount rate for most part of the year coupled with increased short-term borrowings. Net profit measured down by 66.26 percent year-on-year in 2020 to clock in at Rs.298.76 million with NP margin of 2.53 percent. EPS also bottomed out to Rs.13.94 in 2020.
In 2021, SICL posted 25.37 percent year-on-year growth in its net sales which clocked in at Rs.14,784.54 million. Both chemicals and textile segments performed well during the year as the routine business activity resumed after the lockdown period. GDP and LSM registered higher than anticipated growth of 3.94 percent and 9.29 percent respectively in 2021. The revival of economic activity instilled growth momentum in the demand of SITC’s products in 2021 resulting in higher production. Cost of sales also magnified by 24.58 percent year-on-year in 2021. This could’ve been even higher had the energy prices not stabilized during the year.
Gross profit recoiled by 28.68 percent year-on-year in 2021 with GP margin climbing up to 19.84 percent. Significantly lesser advertisement expense coupled with lower freight charges resulted in 9.31 percent contraction in distribution expense in 2021. Administrative expense moved up by a nominal 3.18 percent in 2021 due to curtailed payroll expense and electricity charges. Payroll expense slid despite an increase in the number of employees to 2280 in 2021. SITC posted net other income of Rs.332.28 million in 2021, up 242.21 percent year-on-year primarily due to tremendous gain recognized on the sale of fixed assets in 2021.
Operating profit picked up by 61.91 percent year-on-year in 2021 with OP margin touching the optimum level of 15.38 percent. Finance cost also gave some breather in 2021 as it contracted by 39.26 percent year-on-year due to monetary easing. This was despite increased borrowings during the year to meet working capital requirements as well as finance the ongoing capital expenditure. Net profit ascended by 351 percent year-on-year in 2021 to clock in at Rs.1347.69 million with NP margin of 9.12 percent and EPS of Rs.62.89.
Among all the years under consideration, 2022 witnessed the highest topline growth of 46.27 percent year-on-year. This translated into net sales of Rs. 21,625.49 million in 2022. The economic rebound that began in 2021 continued in 2022, however, it created financial imbalances in the economy due to higher imports, diminishing foreign exchange reserves, mounting current account and fiscal deficit. The volumetric sales as well as prices of chemicals posted growth in 2022, however, the sale of yarn and fabric nosedived during the year.
Cost of sales mounted by 58.23 percent year-on-year in 2022 on account of commodity super cycle in the international market in response to economic rebound and robust demand. Russia-Ukraine war added to ado. This coupled with high indigenous inflation, sharp rise in electricity, petroleum and RLNG prices cut down gross profit by 2 percent year-on-year in 2022 with GP margin drastically falling to 13.28 percent. High POL prices culminated into 37.32 percent year-on-year hike in distribution expense. Administrative expense also enlarged by 18.20 percent on account of high payroll expense as the company hired additional human resources taking the tally to 2380 in 2022. Net other income narrowed down by 41.93 percent year-on-year in 2022 on account of lesser gain on sale of fixed assets.
Operating profit measured down by 21 percent year-on-year in 2022 with OP margin shrinking to 8.30 percent. 48.48 percent spike in finance cost was the effect of monetary tightening during the year. Net profit contracted by 51.35 percent year-on-year in 2022 to clock in at Rs.655.64 million with NP margin of 3 percent and EPS of Rs.30.60.
SITC’s net sales grew by 27.13 percent year-on-year to clock in at Rs. 27,492.64 million in 2023. The company curtailed its production activities during the year on account of import restrictions as well as downtick in demand. The improvement in topline was the result of upward revision in the prices of SITC’s products to pass on the effect of cost spike to the consumers. Cost of sales grew by 22.72 percent year-on-year in 2023 due to hike in energy prices as well as cotton prices after torrential floods. Gross profit grew by 55.92 percent year-on-year in 2023 with GP margin rebounding to 16.30 percent. Hike in ocean freight charges due to exorbitant prices of diesel resulted in 63.30 percent growth in distribution expense in 2023.
Administrative expense also grew by 28.40 percent year-on-year in 2023 due to inflation as well as increase in the number of employees from 2380 in 2022 to 2629 in 2023. Net other income jumped up by 22.30 percent year-on-year in 2023 due to higher amortization of deferred grant, higher rental income, dividend income and mark-up on bank deposits. Operating profit posted growth of 71.95 percent in 2023 with OP margin jumping up to 11.23 percent. Finance cost magnified by 79.63 percent in 2023 due to unprecedented level of discount rate coupled with increased borrowings. SITC registered 51.51 percent year-on-year growth in net profit which clocked in at Rs.993.35 million with EPS of Rs.46.35 and NP margin of 3.61 percent.
In 2024, SITC’s net sales grew by 13.16 percent to clock in at Rs.31,111,88 million. The sales volume of caustic soda slid during the year due to contraction of local textile sector during the year. Conversely, volumetric sales as well as prices of yarn improved during the year. High energy cost resulted in a dip in GP margin which was recorded at 15.81 percent in 2024. In absolute terms, gross profit ticked up by 9.82 percent in 2024. Distribution expense ticked down by 11.26 percent in 2024 due to lower freight and octroi charges on account of lower sales volume of caustic soda. Administrative expense escalated by 15.41 percent in 2024 due to higher payroll expense which was the result of inflationary pressure as well as workforce expansion to 2728 employees. Net other income strengthened by 21.50 percent in 2024 due to lower profit related provisioning done during the year coupled with increase in dividend, mark-up and rental income, gain on sale of investment property as well as gain on sale of fixed assets recorded during the year. The company also recorded higher amortization of deferred grant in 2024. Operating profit grew by 13 percent in 2024 with OP margin staying intact at 11.22 percent.
Finance cost surged by 45.73 percent in 2024 on account of higher discount rate and increased borrowings. Gearing ratio climbed up from 36.38 percent in 2023 to 42.47 percent in 2024. Net profit slumped by 41 percent in 2024 to clock in at Rs.585.507 million with EPS of Rs.27.32 and NP margin of 1.88 percent.
SITC’s net sales ticked up by 4.56 percent to clock in at Rs.32,530.22 million. This was predominantly on the back of improved sales volume and price of caustic soda and other allied chemicals. SITC’s textile segment was initially affected by lesser yarn prices and higher production cost, however, fabric division saved the day for the textile segment by achieving positive volume and price variance. This sustained the overall profitability of the textile segment. Cost of sales inched up by 2.74 percent during the year due to incremental depreciation charge emanating from revaluation of fixed assets done during the period. Gross profit strengthened by 14.22 percent with GP margin climbing up to 17.27 percent. Stable fuel prices coupled with appreciation in the value of local currency resulted in lower freight and octroi charges which squeezed the distribution expense by 9.18 percent in 2025.
Administrative expense escalated by 11.27 percent in 2025 due to workforce expansion to 2736 employees and upward revision in minimum wage rate. Net other income deteriorated by 66.22 percent in 2025 due to higher provisioning done for WWF, WPPF, loss incurred on the disposal of stores and fixed assets as well as lower dividend income, thinner profit on saving deposits and lesser unwinding of deferred consideration receivable against the sale of land. SITC recorded 7.86 percent uptick in its operating profit in 2025 with OP margin ticking up to 11.57 percent. Finance cost shrank by 18.95 percent in 2025 due to monetary easing. This was despite an increase in borrowings which pushed up gearing ratio to 48.59 percent in 2025. Net profit strengthened by 60.42 percent to clock in at Rs.939.275 million in 2025 with EPS of Rs.43.83 and NP margin of 2.89 percent.
Recent Performance (1HFY26)
During the first half of the ongoing fiscal year, SITC recorded 1.28 percent descent in its net sales which clocked in at Rs.15,685.506 million. Lower sales volume of yarn overshadowed the positive performance demonstrated by other segments. Despite lower sales, the company was able to drive its gross profit up by 19.66 percent in 1HFY26 due to reduction in national grid electricity tariff and a decline in international coal prices which also squeezed the cost of captive power generation. Lower power cost pushed down cost of sales by 5.244 percent in 1HFY26. GP margin was recorded at 19.29 percent in 1HFY26 versus 15.92 percent in 1HFY25.
Distribution expense hiked by 47.65 percent in 1HFY26 due to higher POL prices which drove up the freight charges. Administrative expense also ticked up by 7.90 percent in 1HFY26 due to upward revision in minimum wage rate and likely due to workforce expansion. Increased provisioning done for WWF and WPPF appears to be the cause of 115.12 percent escalation in other expense in 1HFY26. Other income dipped by 24.404 percent in 1HFY26 apparently due to thinner dividend income and petite profit on bank deposits due to monetary easing. SITC recorded 9.03 percent stronger operating profit in 1HFY26 with OP margin clocking in at 12 percent versus OP margin of 10.88 percent posted in 1HFY25.
Finance cost tapered off by 39.23 percent in 1HFY26 due to monetary easing. Net profit rebounded by 98.60 percent to clock in at Rs.724.778 million in 1HFY26. This translated into EPS of Rs.33.82 in 1HFY26 versus EPS of Rs.17.03 recorded in 1HFY25. NP margin climbed up from 2.30 percent in 1HFY25 to 4.62 percent in 1HFY26.
Future Outlook
The revival in economic activity on account of improvement in macroeconomic indicators will further buttress the demand of caustic soda, resulting in improved topline and margins for SITC. Downward revision of discount rate will keep the finance cost in check. The company is also in the final phase of commissioning its 50 MW coal fired power plant which will rein-in its energy cost and make its operations more efficient. Downside risk include ongoing tension in the Middle East which can impact the global POL supply chain and result in another vicious cycle of inflation in major oil importing economies including Pakistan.


Comments