


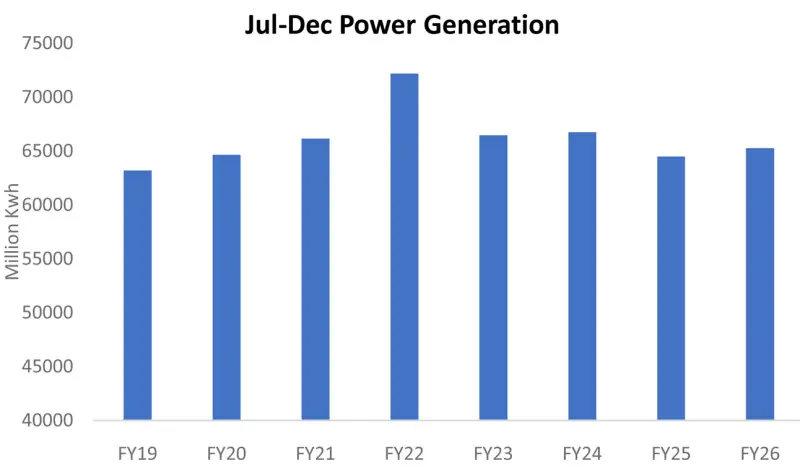
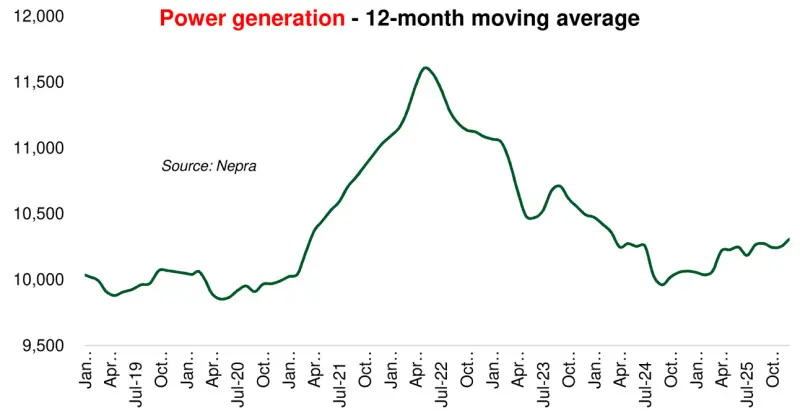
Pakistan’s national grid power generation in 1HFY26 remained 10 percent below the peak observed in 1HFY22. At 65 billion kilowatt hours, output was still lower than the same period in 2020, and only marginally higher than levels recorded in 2018 and 2019.
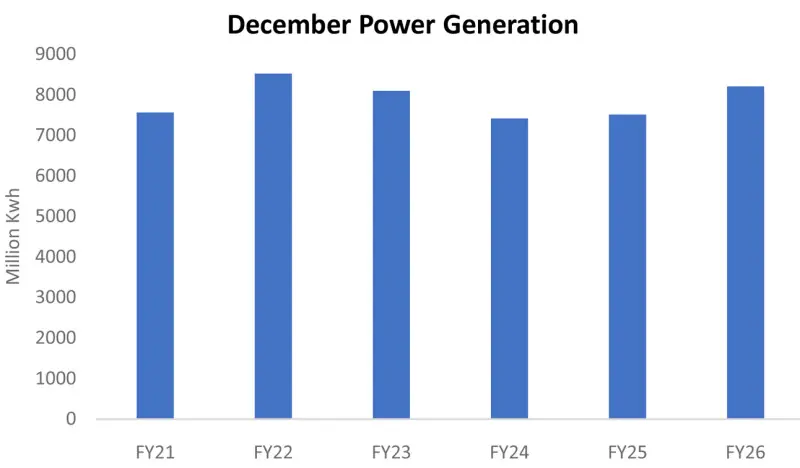
December, however, stood out from the broader trend. It marked only the third instance in the past 18 months where actual generation exceeded reference generation.
On a year-on-year basis, December generation was up 9 percent, the strongest growth recorded so far in FY26. This improvement coincided with the introduction of the winter consumption incentive package, which became effective from December and appears to have played a meaningful role in lifting demand.
This is in addition to the ongoing reintegration of previously captive industrial consumers into the grid, which has resulted in industrial demand from the grid rising by as much as 35 percent year on year.
Despite these tailwinds, cumulative generation in 1HFY26 improved by barely 1 percent compared to last year, implying a pronounced contraction in other demand segments, particularly domestic and agricultural consumption.
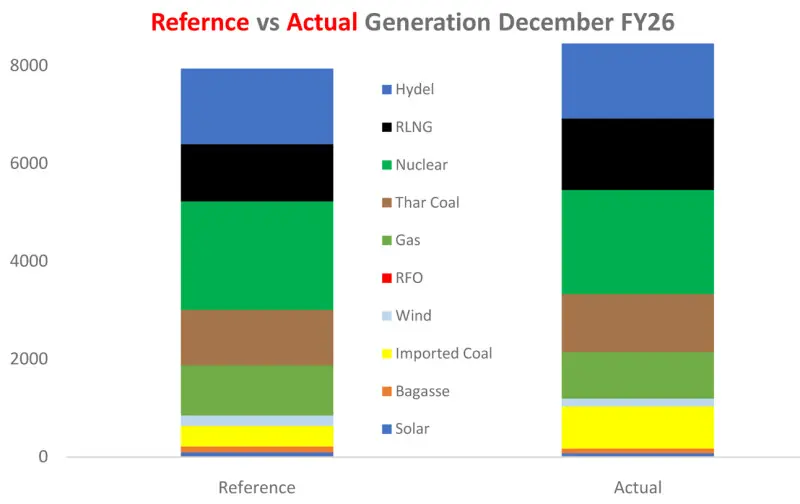
While aggregate generation exceeded reference levels, the composition of supply presents a more instructive picture. Seasonal weakness in hydel output shifted the burden towards imported fuels.
RLNG based generation was around 25 percent higher than planned, while imported coal recorded the most significant deviation. Actual coal-based generation rose to 860 million units against a reference of 422 million units. This reliance on costlier imported fuels largely explains the upward pressure seen in monthly fuel charge adjustments.
Demand patterns are also reshaping operational dynamics. Evening demand spikes following sunset are becoming more pronounced, increasing reliance on RLNG and coal fired plants to meet short term load requirements. These plants are increasingly central to managing ramp up needs as the system adjusts to changing consumption behavior.
With the incremental consumption relief package for industry and agriculture now in place, the trajectory of grid demand will hinge to the extent to which these incentives translate into sustained usage.
While industrial feedback has so far been sharply critical, this response may be overstated. With a substantial number of captive users already shifted back to the grid and incremental consumption priced at a meaningful discount, industrial demand should continue to strengthen, assuming no adverse policy or pricing shocks.


















Comments
Comments are closed for this article.