


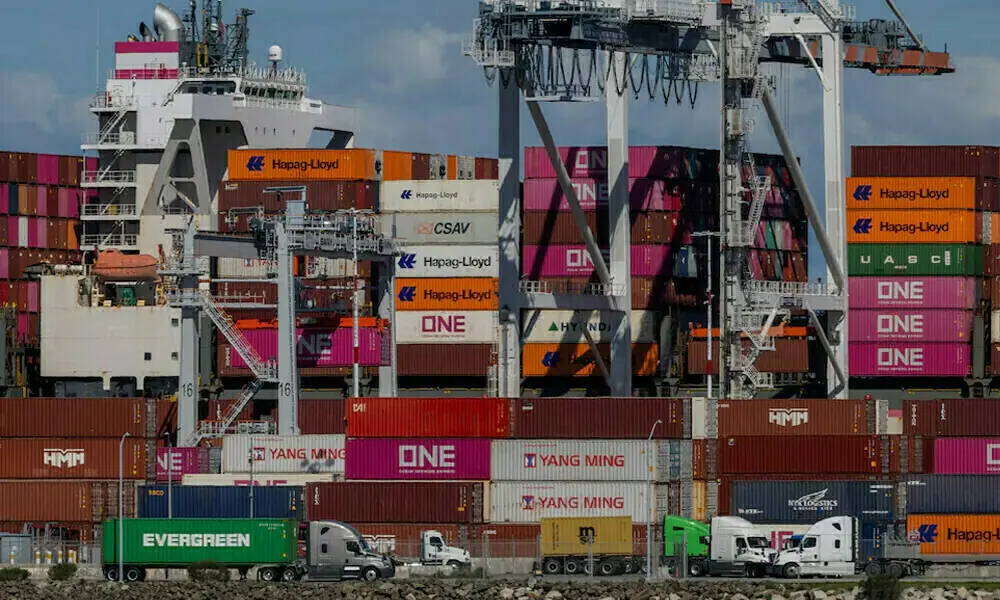

The global economy today is shaped as much by trade policy as by technology, capital flows, and geopolitics, and few countries influence this balance more than the United States.
The American economy’s scale means that every tariff decision sends signals far beyond its borders, affecting supply chains, prices, alliances, and political calculations.
The debate around US tariffs has therefore never been only about customs duties but it has been about sovereignty, leverage, domestic industry, and the reordering of global economic power.
United States’ economic weightage provides essential context for understanding why tariffs remain such a powerful policy tool. The World Bank statistics place the total current GDP of the global economy at US$ 110.98 trillion, with the United States standing as the largest economy at US$ 28.7 trillion, representing roughly 26 percent of global output.
The United States also ranks first in global imports at US$ 4.10 trillion in 2024 and second in exports at US$ 3.19 trillion. The sheer scale of this footprint ensures that any adjustment in US trade policy has immediate and measurable global consequences.
Growing integration of capital, labour, technology, and supply chains has made the global economy highly interdependent and more exposed to shocks and strategic rivalry.
Policymakers in Washington increasingly view this interdependence as both an economic strength and a strategic vulnerability, particularly in sectors such as technology, energy, and advanced manufacturing.
The response has been a shift in trade and industrial policy focused on strength, domestic employment, and reduced dependence on rivals.
The most visible outcome has been a new and relatively heavy round of tariffs aimed at countries with persistent trade gaps. The policy triggered sharp domestic debate and prompted international retaliation that wrenched trade ties and diplomatic relationships.
The economic rationale for tariffs, however, was closely tied to the alarming pattern of the US trade deficit prior to their imposition. Data show that in the first three months before the new tariffs took effect, the average monthly trade deficit stood at US$ 128,499 million, cumulating to US$ 385,498 million in the first quarter.
The scale of this imbalance was widely viewed within policy circles as unsustainable, both economically and politically, reinforcing the argument that decisive intervention was necessary.
Post-tariff data indicate a dramatic shift in the trade balance. The latest releases show that the US trade deficit fell sharply to US$ 29,530 million, marking the lowest level since 2009.
The decline was presented by the administration as evidence that tariffs were achieving their intended effect by suppressing imports, reshoring certain activities, and strengthening the negotiating position of the United States in bilateral trade relationships.
The country’s level breakdown of trade balances further illustrates the differentiated impact of tariff policy.
October 2025 data show US trade surpluses with Switzerland at US$ 7.3 billion, the United Kingdom at US$ 6.8 billion, South and Central America at US$ 5.6 billion, the Netherlands at US$ 5.1 billion, Hong Kong at US$ 2.8 billion, Brazil at US$ 2.7 billion, Singapore at US$ 1.8 billion, Australia at US$ 1.7 billion, Belgium at US$ 1.1 billion, and Saudi Arabia at US$ 0.2 billion. The figures highlight how trade outcomes vary significantly depending on market structure, currency dynamics, and the composition of bilateral trade.
The deficit side of the ledger remains equally instructive. October 2025 data recorded trade deficits with Mexico at US$ 17.9 billion, Taiwan at US$ 15.7 billion, Vietnam at US$ 15.0 billion, China at US$ 13.7 billion, European Union at US$ 6.3 billion, Germany at US$ 5.1 billion, Japan at US$ 4.2 billion, Ireland at US$ 3.2 billion, South Korea at US$ 2.9 billion, India at US$ 2.3 billion, Canada at US$ 2.3 billion, Malaysia at US$ 2.0 billion, France at US$ 1.3 billion, Israel at US$ 0.8 billion, and Italy at US$ 0.5 billion.
Persistent deficits with key manufacturing hubs highlights the structural nature of many bilateral trade gaps.
The country-specific movements within these aggregates reveal important dynamics. The trade deficit with Ireland narrowed by US$ 15.1 billion to US$ 3.2 billion in October, driven by a modest US$ 0.1 billion increase in exports to US$ 1.8 billion and a dramatic US$ 15.0 billion decline in imports to US$ 5.0 billion.
The shift reflects both demand adjustments and strategic sourcing changes by US firms. The trade surplus with the United Kingdom expanded by US$ 5.7 billion to US$ 6.8 billion during the same period, supported by a US$ 5.2 billion rise in exports to US$ 11.4 billion and a US$ 0.6 billion decline in imports to US$ 4.6 billion.
However, the experience with Taiwan highlights the limits of tariff effectiveness in certain sectors.
The trade deficit with Taiwan widened by US$ 6.3 billion to US$ 15.7 billion in October, as exports declined marginally to US$ 4.8 billion whereas imports surged by US$ 6.2 billion to US$ 20.5 billion. This outcome reflects the intensity of advanced semiconductor manufacturing in Taiwan, where short-term substitution remains difficult despite tariff pressure.
The earlier data from March 2025 highlight the volatility and uneven adjustment of trade balances. The United States recorded trade surpluses with the Netherlands at US$ 4.5 billion, South and Central America at US$ 3.2 billion, Hong Kong at US$ 1.9 billion, the United Kingdom at US$ 1.2 billion, Singapore at US$ 0.5 billion, Brazil at US$ 0.5 billion, and Saudi Arabia at US$ 0.2 billion.
The same period, however, saw substantial trade deficits with the European Union at US$ 48.3 billion, Ireland at US$ 29.3 billion, China at US$ 24.8 billion, Mexico at US$ 16.8 billion, Switzerland at US$ 14.7 billion, Vietnam at US$ 14.1 billion, Taiwan at US$ 8.7 billion, India at US$ 7.7 billion, Germany at US$ 7.5 billion, South Korea at US$ 6.8 billion, Japan at US$ 5.8 billion, Canada at US$ 4.9 billion, Italy at US$ 4.4 billion, France at US$ 3.9 billion, Malaysia at US$ 3.2 billion, Australia at US$ 1.0 billion, Israel at US$ 1.0 billion, and Belgium at US$ 0.1 billion.
The cumulative evidence suggests that tariffs have indeed altered trade flows and strengthened the US negotiating position in selected relationships, but they have not eliminated structural deficits across the board. The policy has delivered measurable reductions in aggregate deficits and increased leverage, but it has also introduced higher costs, market uncertainty, and diplomatic friction.
The tariffs have thus become not merely a trade instrument but a central driver of broader US economic and foreign policy, shaping how Washington engages allies, competitors, and global institutions.
The implications of this policy are particularly relevant for developing economies seeking deeper access to the US market, including Pakistan.
The country maintains one of the lowest average tariff regimes in its region, but this benefit has not translated into a commensurate expansion of exports to the United States. The export performance remains hindered due to structural challenges rather than market access barriers, raising questions about whether the country is utilizing its full trade potential.
The core challenge for Pakistan lies in competitiveness rather than tariffs. The export basket remains narrow and concentrated on low value-added products, limiting resilience against demand shifts and price competition.
The industrial base continues to face energy challenges, logistics issues, and inconsistent regulatory enforcement, all of which erode the reliability demanded by US buyers. The compliance standards required for entry into the American market, particularly in areas such as labour, environmental safeguards, and product quality, remain unevenly met.
Pakistan’s trade performance with the United States will improve less through further tariff concessions and more through domestic reform.
Similarly, investment in productivity, diversification into higher value-added exports, and closer alignment with US regulatory and compliance standards are essential.
The improvements in trade facilitation, customs efficiency, logistics, and contract enforcement would strengthen credibility with American buyers, whereas targeted engagement with US firms seeking supply chain expansion could create real openings.
The experience of US tariff policy makes clear that market access alone does not deliver export growth, competitiveness, scale, reliability, and compliance matter far more than low tariff rates. Therefore, addressing these issues would not only expand Pakistan’s exports to the United States but also deepen its integration into the changing global economy.
Copyright Business Recorder, 2026
The writer is a lawyer and author, is an Adjunct Faculty at Lahore University of Management Sciences (LUMS), member Advisory Board and Senior Visiting Fellow of Pakistan Institute of Development Economics (PIDE)
The writer, an Advocate Supreme Court, Adjunct Faculty at Lahore University of Management Sciences (LUMS), member Advisory Board and Visiting Senior Fellow of Pakistan Institute of Development Economics (PIDE), holds LLD in tax laws
The writer is a corporate lawyer based in the US with extensive expertise in financial regulations, including Virtual Asset Service Providers (VASPs), corporate governance, and global economic policies. He holds an LLM from Washington University in St. Louis and has completed the Management Development Program at the Wharton School. He has developed regulatory frameworks for North American and South American Financial Institutions and has consulted and trained bureaucrats of different regions. He can be reached at [email protected]



















Comments
Comments are closed for this article.