


BR RESEARCH: Pakistan’s FDI: weaker numbers, fragile confidence


Foreign direct investment into Pakistan declined in Nov-25, and the broader July–November FY26 picture reinforces an uncomfortable reality: inflows remain narrow, volatile, and driven more by a handful of legacy relationships than by renewed investor confidence.
According to State Bank of Pakistan data, net FDI in Nov-25 fell 16 percent year-on-year to $180 million, compared to $214 million in Nov-24.
More importantly, cumulative net FDI during 5MFY26 declined 25 percent to $927 million, down from $1.24 billion in the same period last year.
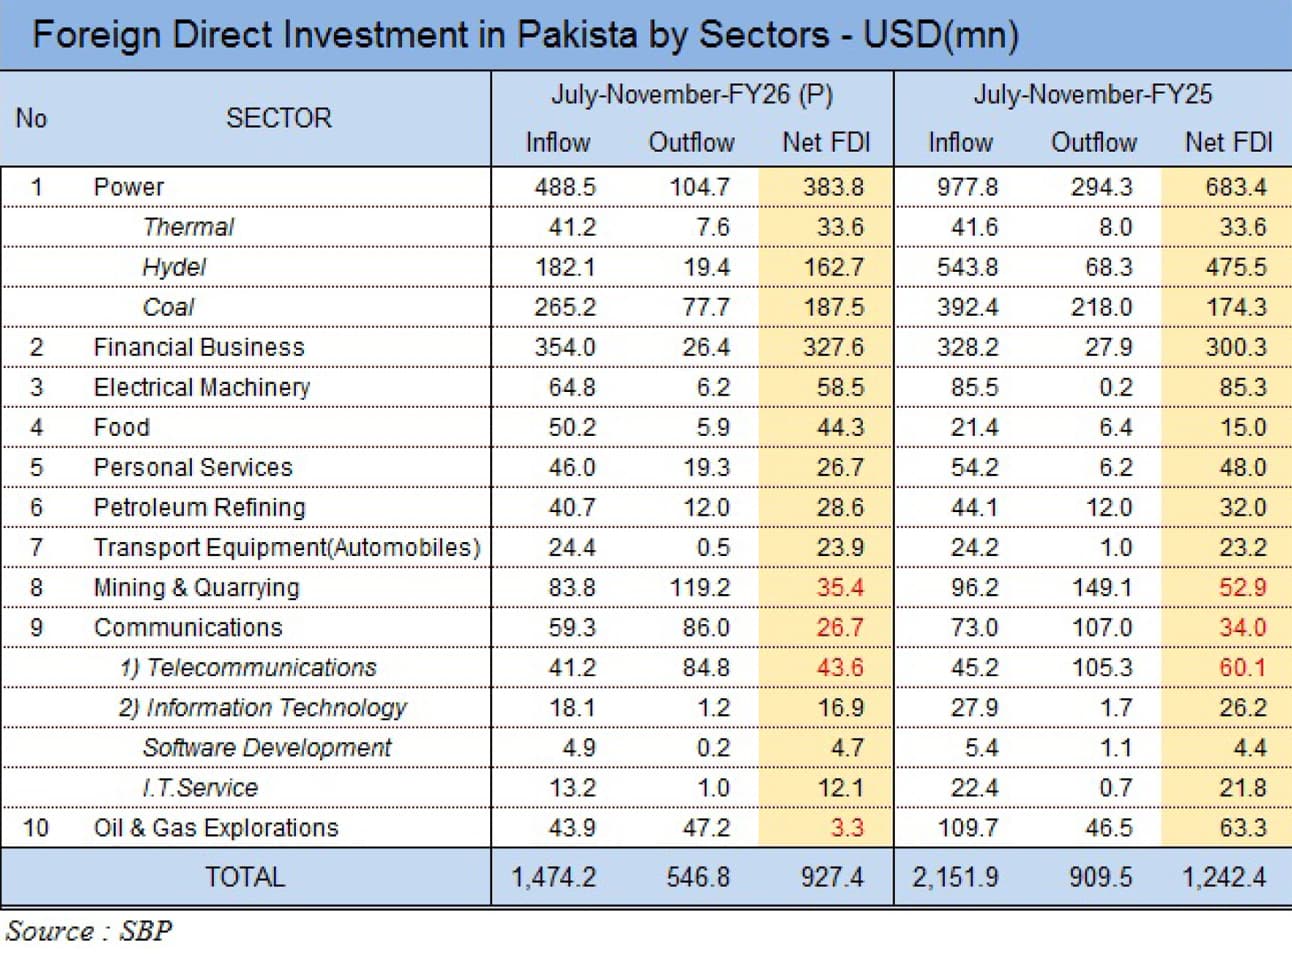
The message from the numbers is clear: inflows have weakened, not strengthened.
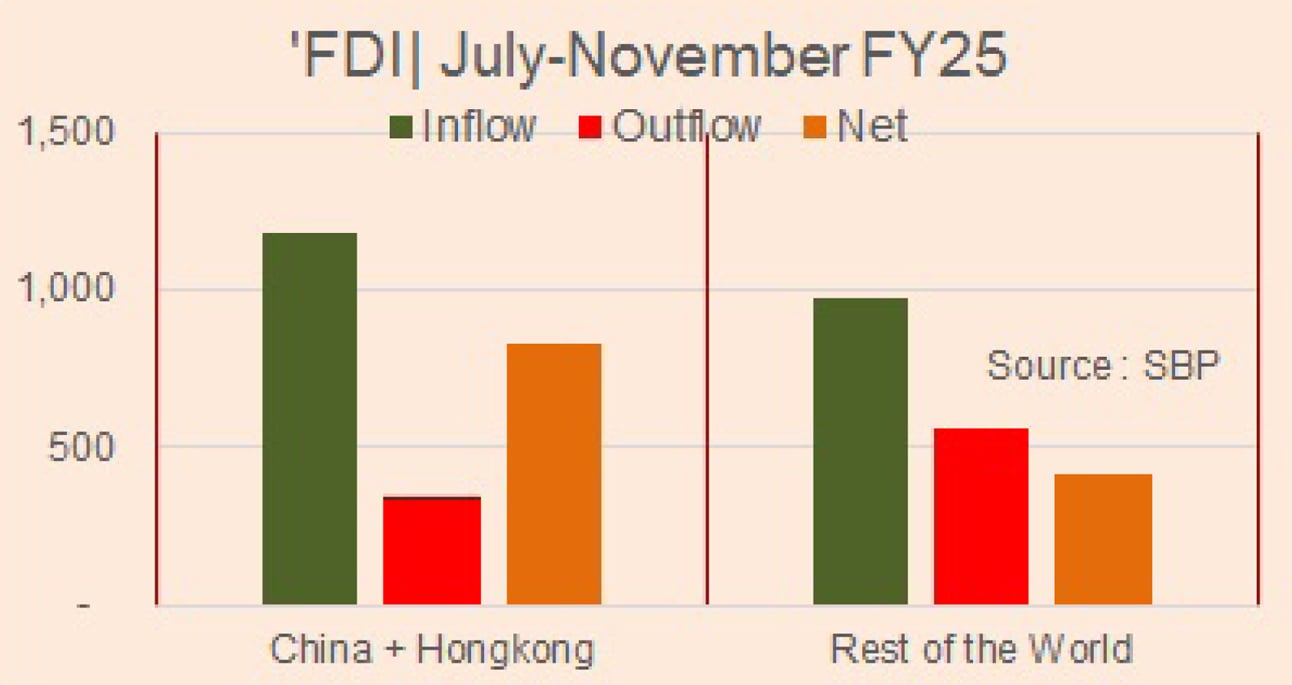
As in recent months, China (including Hong Kong) dominated inflows during November and across 5MFY26. Power—particularly coal-linked projects—along with a limited set of financial and infrastructure investments accounted for most of the net inflows.
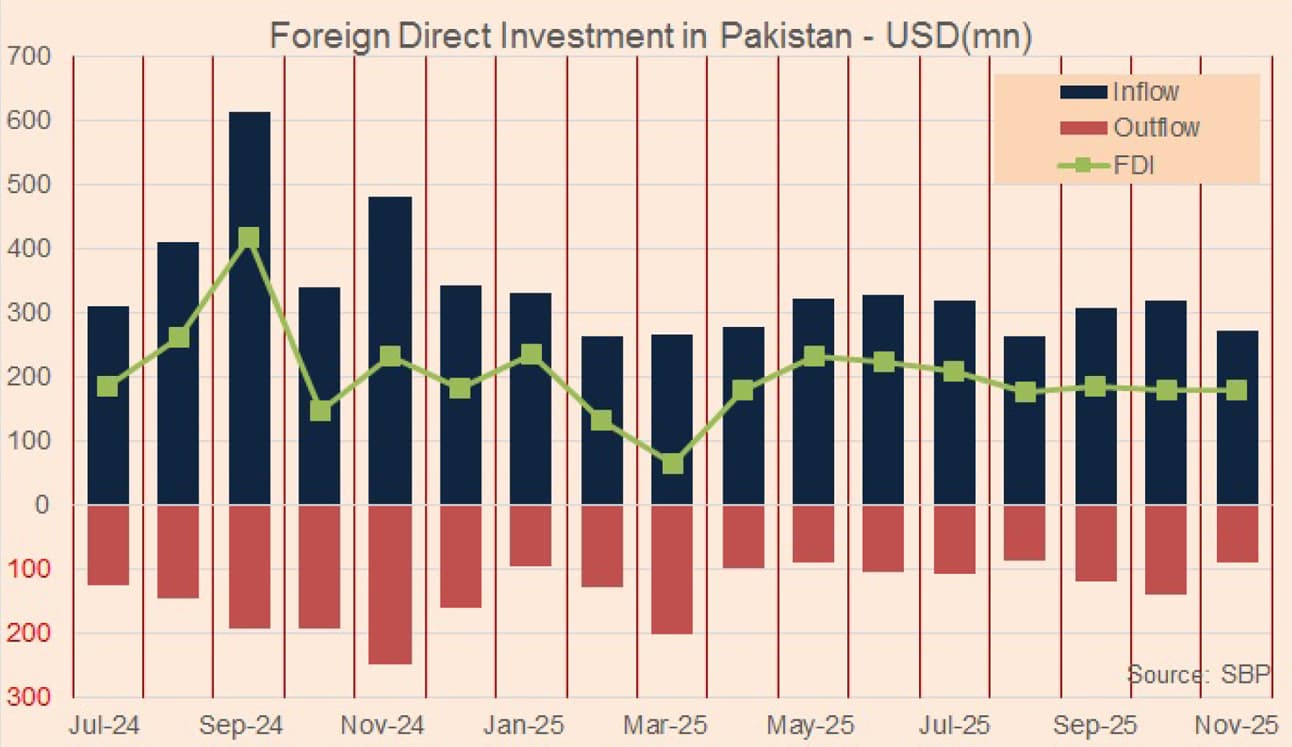
In contrast, FDI from the rest of the world remained subdued, with fresh commitments largely offset by outflows.All in all, outside China-linked flows, Pakistan’s FDI profile remains thin and episodic, leaving headline numbers vulnerable to reversal.
The sectoral composition of FDI during 5MFY26 underscores this narrow base. The power sector alone attracted roughly $384 million, followed by financial services at about $328 million. Beyond these segments, traction was limited.
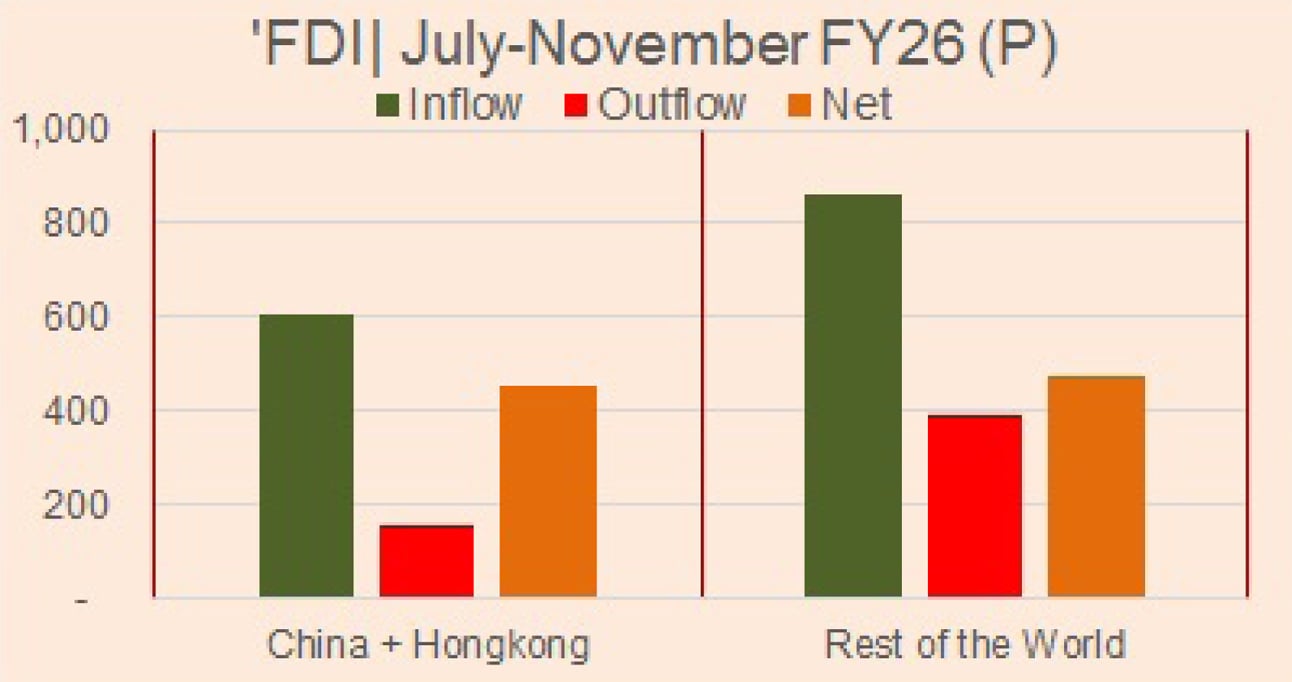
Communications and several service sectors continued to post net outflows, highlighting persistent pressure on regulated and consumer-facing industries.
Pakistan’s investment challenge is structural rather than cyclical. Governments have repeatedly announced privatization plans, roadshows, and facilitation mechanisms, yet execution has lagged.
Policy reversals, tariff renegotiations, and retrospective regulatory actions have reinforced the perception that rules can change after capital is committed.
Pakistan’s Nov-25 FDI outcome represents a clear slowdown. The 25 percent decline in 5MFY26 confirms that inflows remain concentrated, fragile, and credibility constrained. Without a sustained shift toward policy stability, contract sanctity, and predictable regulation, FDI will continue to arrive sporadically rather than as durable confidence capital.




















Comments
Comments are closed for this article.