




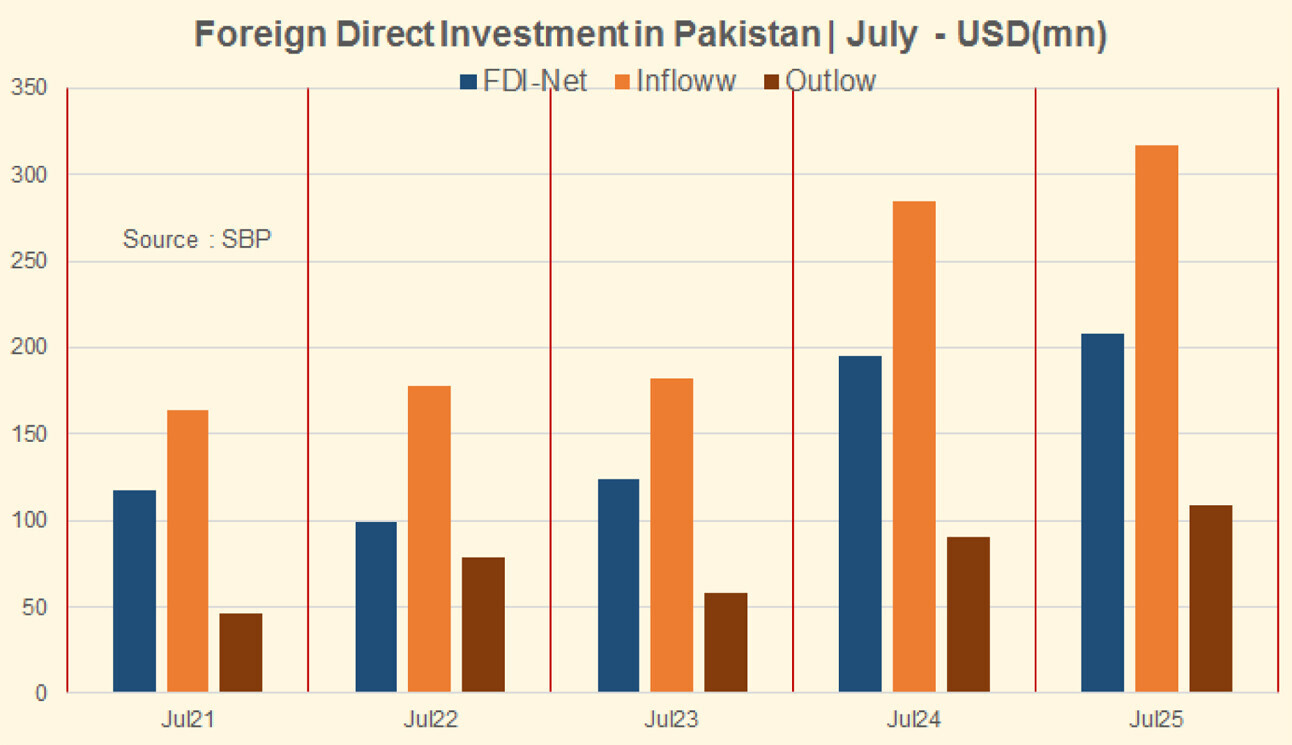
Foreign direct investment (FDI) in Pakistan increased by 7 percent year-on-year in July 2025, but the trend remains essentially unchanged. Monthly net inflows continue to hover around the $200 million range, where they have been stuck for a long time.
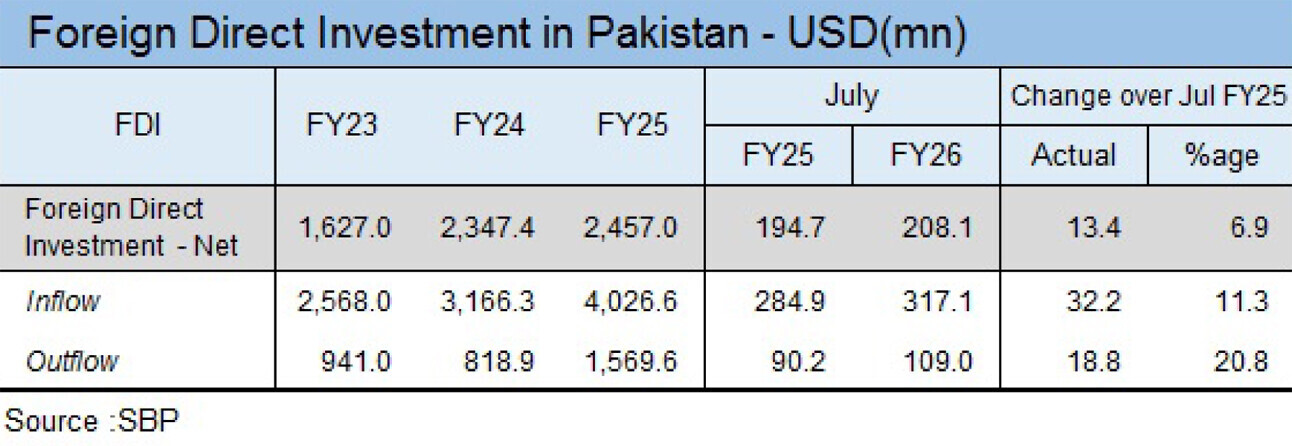
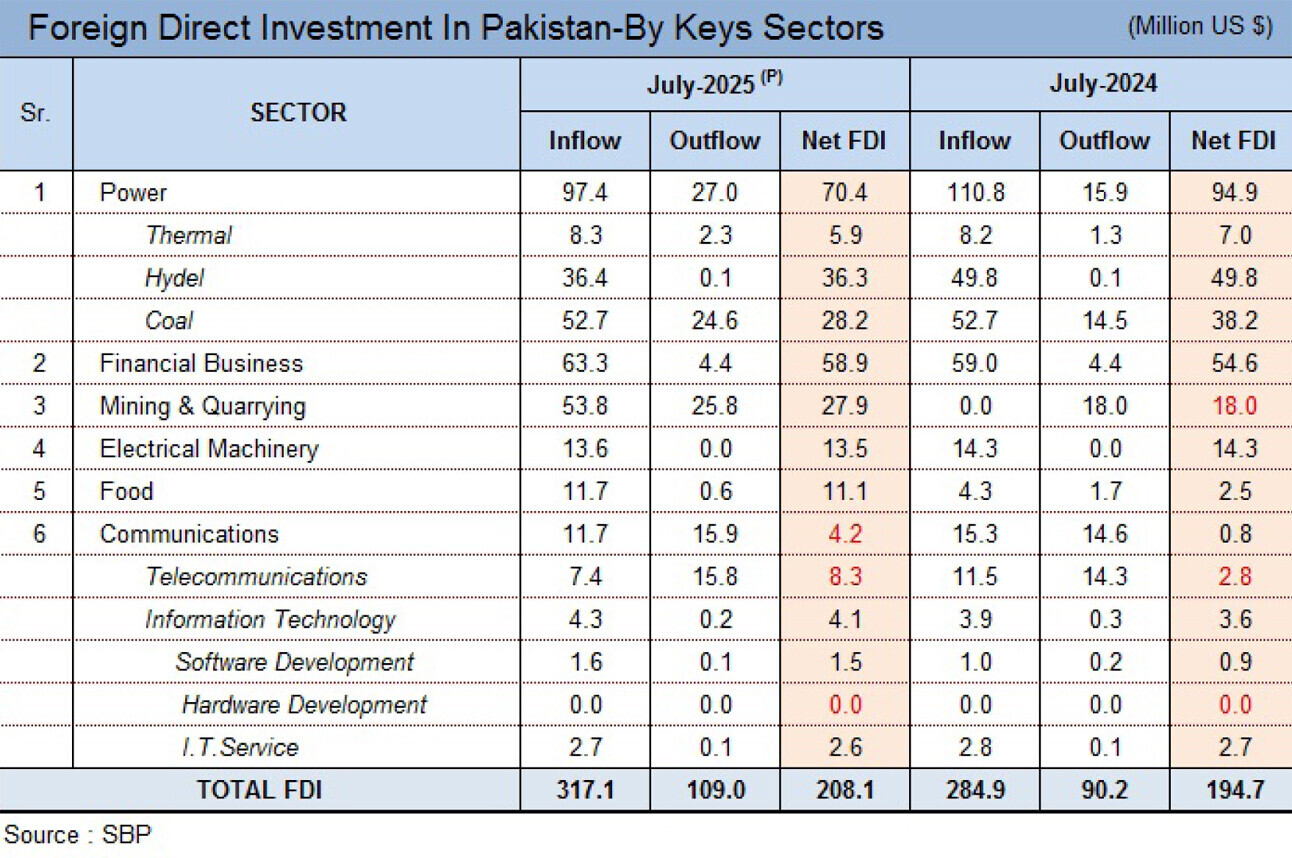
Net FDI in July stood at $208 million, compared to $195 million a year earlier. Gross inflows rose 11 percent to $317.1 million, while outflows climbed 21 percent to $109.0 million.
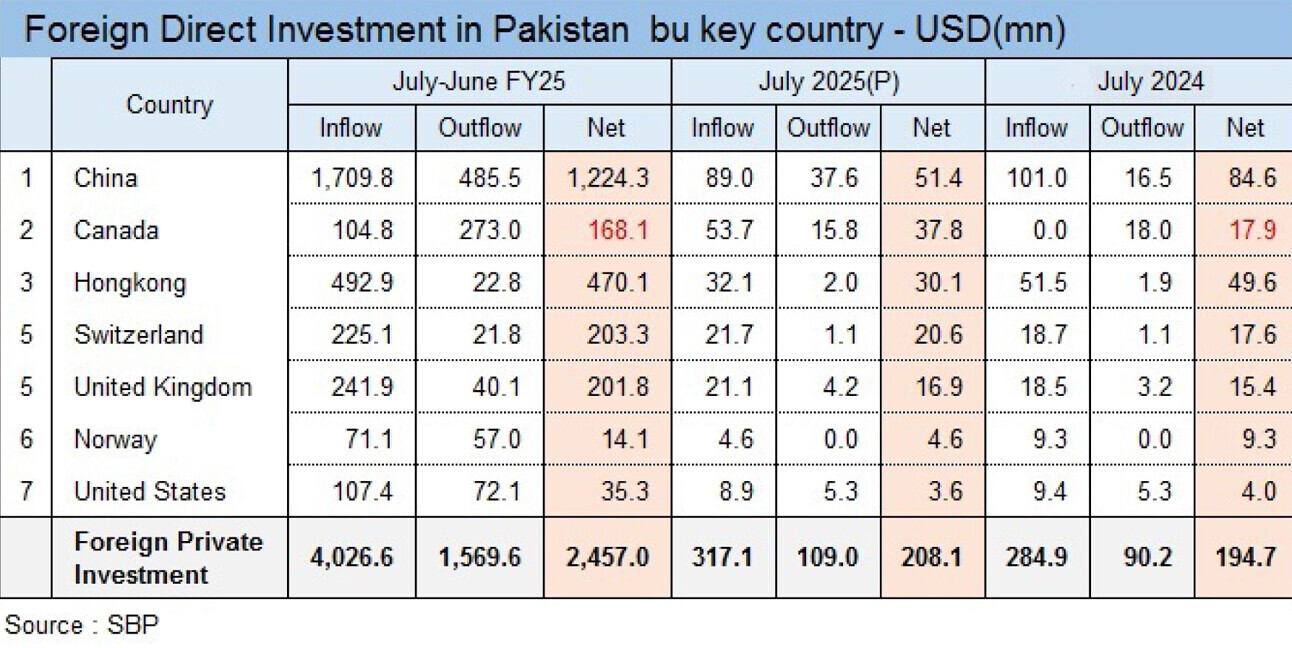
Country-wise, China led with $51 million net, followed by Hong Kong ($30 million), Switzerland ($21 million), and the United Kingdom ($17 million). Canada, which recorded large net outflows in FY25, posted a modest recovery with $38 million net in July. The United States ($4m) and Norway ($5m) contributed smaller amounts.
Sector-wise, the power sector attracted the largest share of FDI at $70.4 million, driven by hydel ($36.3 million) and coal ($28.2 million) projects, with smaller inflows into thermal ($5.9 million). Financial services followed with $58.9 million, while mining and quarrying brought in $27.9 million.
Manufacturing-related inflows included electrical machinery ($13.6m) and food ($11.1m). By contrast, communications posted a net outflow of $4.2 million, with repatriations in telecom offsetting modest IT-related inflows (~$4.1m across software and IT services).
Looking at the broader picture – and the FY25 FDI landscape - net FDI was $2.46 billion in FY25, effectively stagnant and concentrated in a few sectors—nearly half in power—mainly reflecting committed projects in an industry facing overcapacity.
Geographically, inflows were dominated by China and Hong Kong, with little from the Middle East or Western economies.
Other sectors, including telecom and construction, saw declining investment, while several multinational companies exited due to unfavourable tax and energy policies.
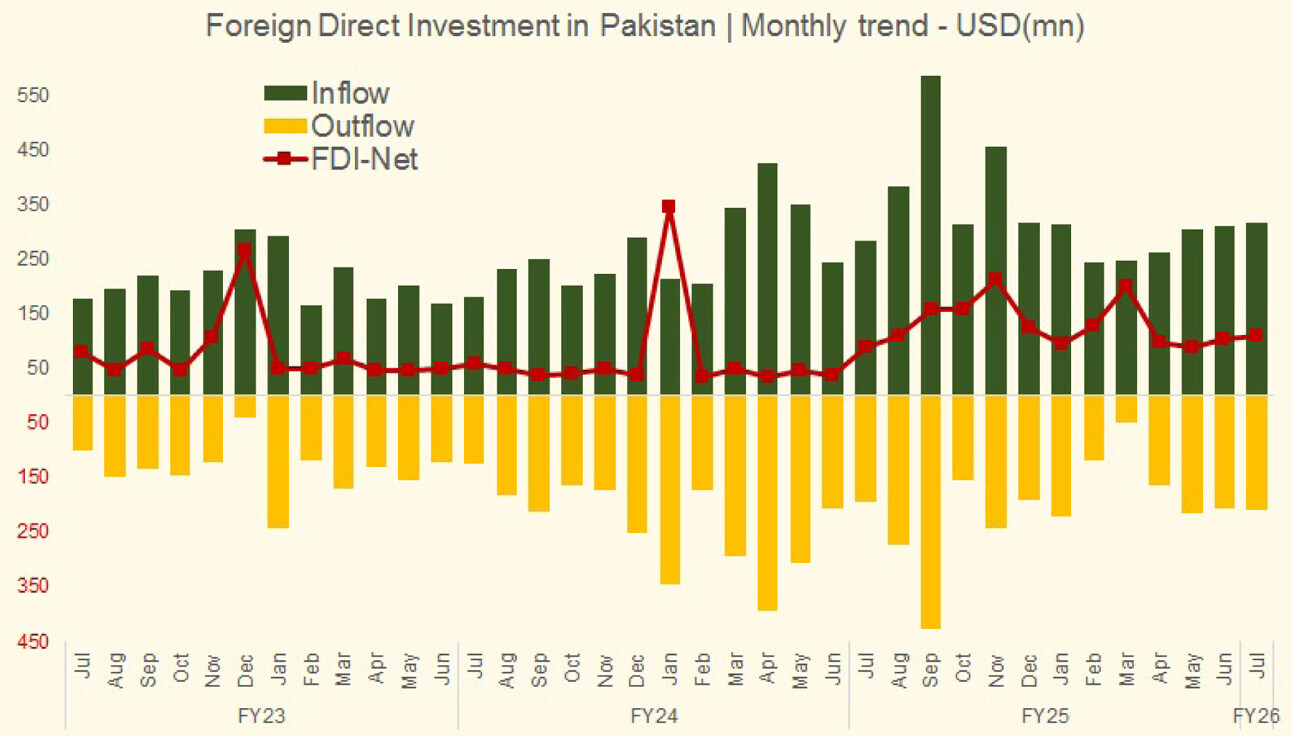
Despite some commentary linking stronger macroeconomic indicators to an improved investment outlook, the data show otherwise: macroeconomic stability alone has not attracted fresh capital.
Without structural reforms and a clear growth trajectory, Pakistan remains reliant on narrow, fragile inflows rather than broad-based new investment.
Diversification remains limited. China continues to dominate FDI, particularly in power, while other sources remain small. U.S. interest has begun to appear in mining and ICT, but meaningful expansion into new sectors and geographies will require policy correction in energy pricing, taxation, and regulatory predictability.




















Comments
Comments are closed for this article.