


Contrary to earlier celebratory headlines, Pakistan’s foreign direct investment (FDI) performance in FY25 remains modest. While the cumulative FDI during the first eight months of FY25 rose to $1.618 billion—marking a 41 percent increase year-on-year—this apparent improvement reflects base effects and episodic capital inflows rather than a sustained surge in investor confidence or macroeconomic fundamentals. For instance, net FDI in February 2025 stood at just $94.7 million, a steep 45 percent drop compared to February 2024.
The FDI landscape continues to be dominated by the financial services, power, and oil & gas exploration sectors. In February alone, the financial sector absorbed $52.55 million, followed by $26.99 million in power and $9.59 million in oil & gas exploration. However, the data points to a lack of diversification. Sectors such as IT, manufacturing, and clean tech—where Pakistan’s regional peers are experiencing robust growth—remain underrepresented in the FDI mix.

Geographically, FDI remains highly concentrated. China alone accounted for over 40 percent of total net inflows. Western capital, while not entirely absent, remains cautious. Inflows from the UK have shown some activity but remain far below what regional competitors attract.

While recent trends indicate a mild resurgence, Pakistan’s FDI inflows still lag historical norms. Key obstacles include political instability, policy inconsistency, legal ambiguities, and exchange rate volatility. These factors continue to deter long-term capital commitments. Investors remain hesitant amid sudden governance changes and macroeconomic uncertainties.

In short, the FDI figures for the first eight months of FY25 suggest a modest improvement, but the momentum remains fragile. For this uptick to translate into sustainable growth, Pakistan must prioritize political continuity, macroeconomic stabilization, meaningful reforms, and a coherent long-term investment strategy. Otherwise, the current increase may prove short-lived.

Alongside the rise in FDI, Pakistan is witnessing a significant resurgence in profit repatriation by foreign investors—a trend that presents both positive signals and underlying concerns.
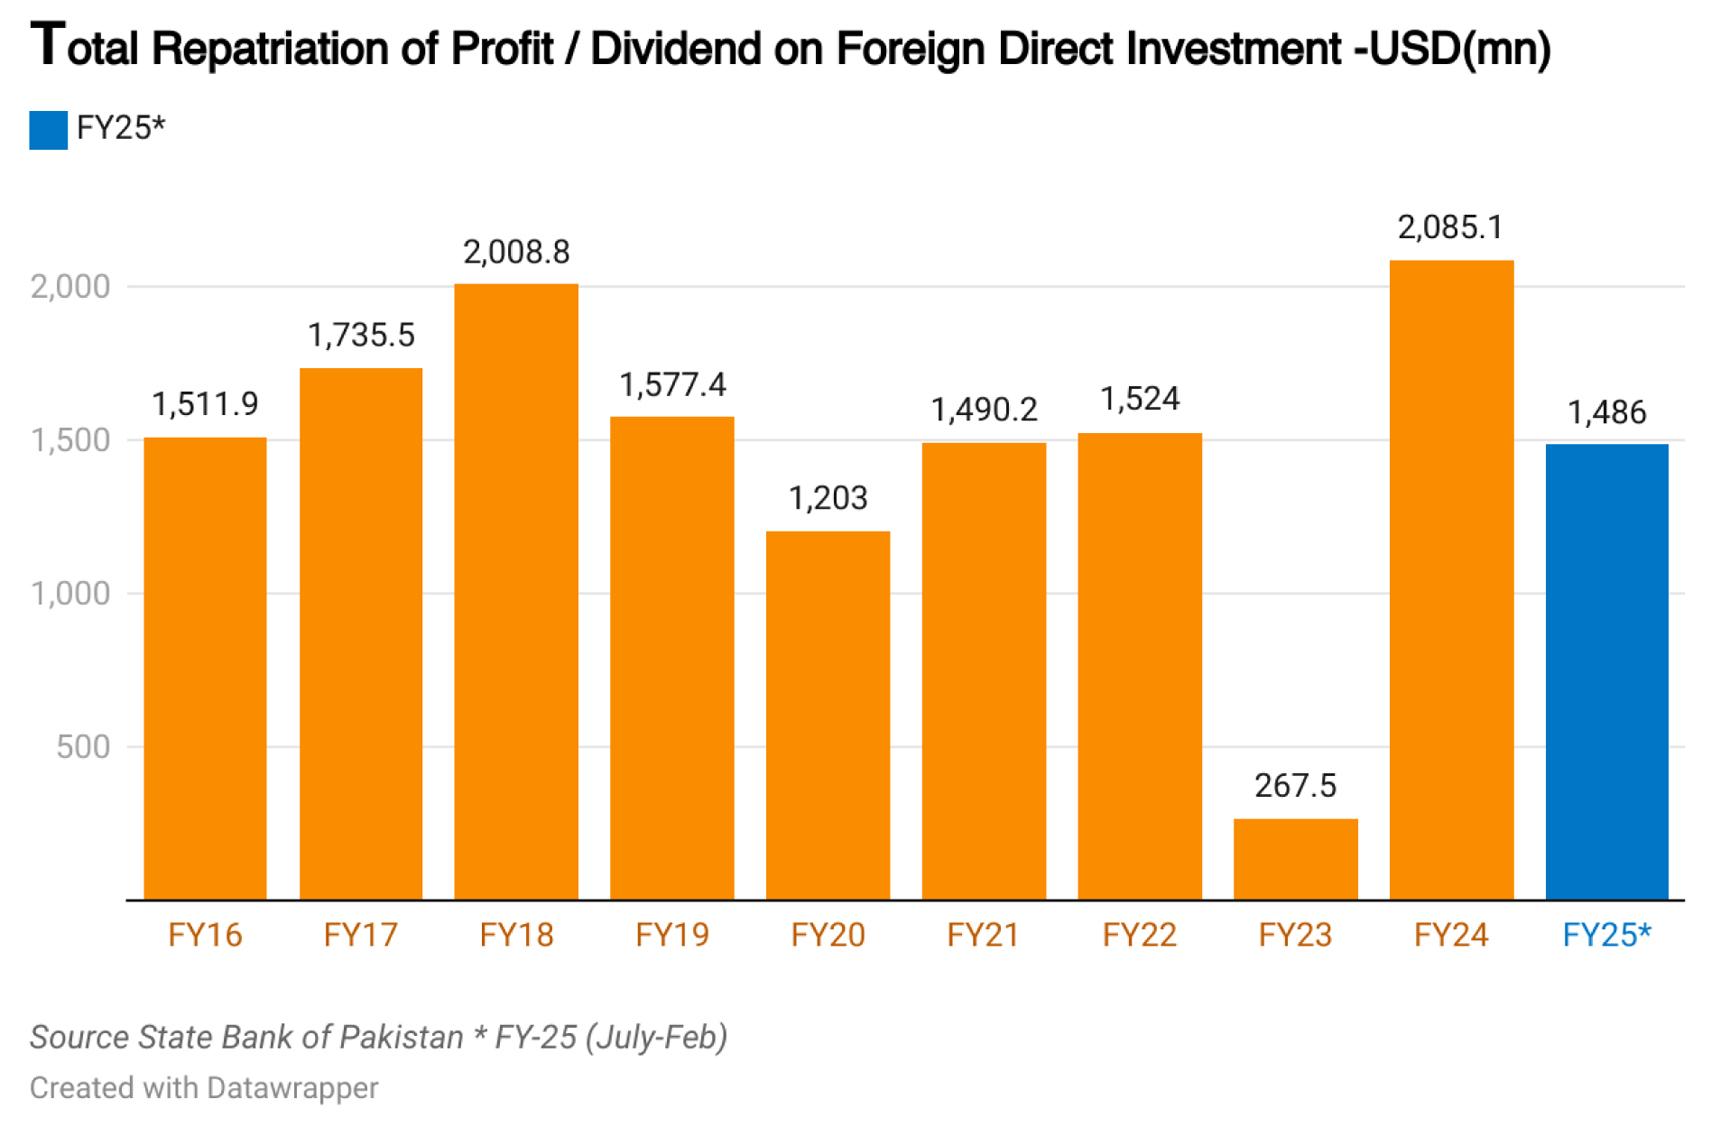
In FY24, foreign companies repatriated $2.21 billion from Pakistan, marking a six-year high. This upward trend persisted into FY25. During the first eight months (July–February), total repatriations reached $1.486 billion, up dramatically from just $267.5 million in the same period last year (8MFY23). With four months still remaining in FY25, this figure is already approaching full-year levels of FY22 and FY24. The United Kingdom led the outflows with $489 million, followed by the United States ($160 million), the Netherlands ($133 million), and the UAE ($131 million).
On the positive side, the sharp increase in repatriation signals improving investor confidence and restored ability to transfer profits abroad—something that had been restricted due to Pakistan’s FX liquidity crisis in FY23. The normalization of outflows reflects easing capital controls and a more predictable foreign exchange environment, which can further encourage FDI inflows.

However, the scale of repatriation relative to FDI inflows raises deeper concerns. In some cases, repatriated profits have exceeded 50 percent and even 100 percent of net FDI inflows, which dilutes the long-term developmental impact of foreign investment. In FY25, the food industry led in repatriation with $247 million, followed closely by the financial and power sectors. High repatriation outflows from key sectors suggest that the benefits of initial capital inflows are not being fully retained within the economy.

This trend also intensifies Pakistan’s balance-of-payments pressures and highlights gaps in policy—particularly the lack of incentives for reinvestment. Multinational companies often send dividends, royalties, and profits back to their home countries without reinvesting locally. While repatriation is a natural part of global investment flows, excessive outflows without local reinvestment undermine long-term value creation and economic sustainability.


Comments
Comments are closed for this article.