


Power Cement Limited (PSX: POWER) was incorporated in Pakistan as a private limited company in 1981 and was converted into a public limited company in 1987. The company is engaged in the manufacturing, marketing, and selling of cement. The company operates under the umbrella of Arif Habib Group.
Pattern of Shareholding
As of June 30, 2024, POWER has a total of 1111.885 million shares outstanding which are held by 9799 shareholders. Associated companies, undertakings, and related parties have the majority stake of 62.77 percent in the company followed by the local general public holding 25.67 percent shares. Directors, CEO, their spouses, and minor children account for 7.04 percent of the outstanding shares of POWER. The remaining shares are held by other categories of shareholders.
Historical Performance (2020-24)
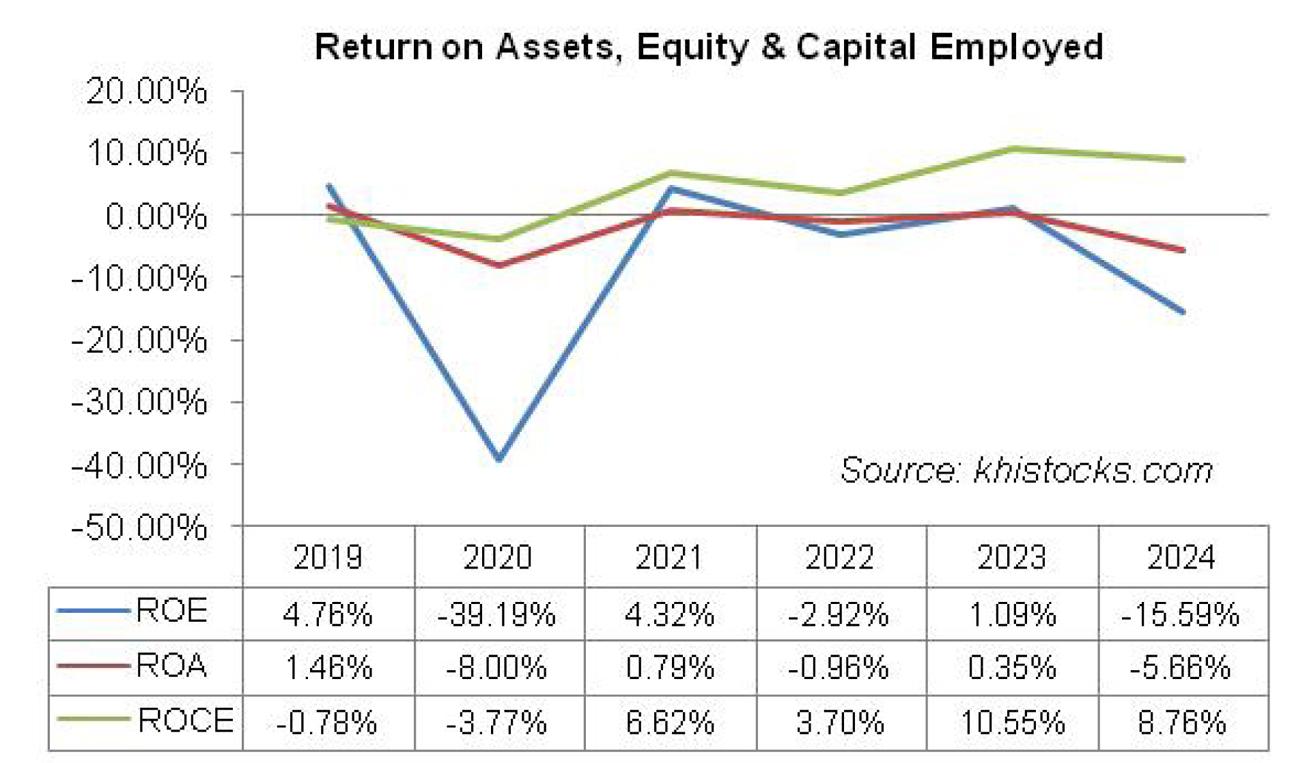
POWER’s topline rode an upward trajectory over the period under consideration. However, its bottom line is not reflective of the same with net losses registered in 2020, 2022, and 2024. In the remaining two years, the company posted net profit; however, it also notably shrank from 2021 to 2023. The company’s margins drastically fell in 2020 followed by a rebound in 2021. The similar pattern was repeated in 2022 and 2023. In 2024, POWER’s margins nosedived yet again (see the graph of profitability ratios). The detailed performance review of the period under consideration is given below.
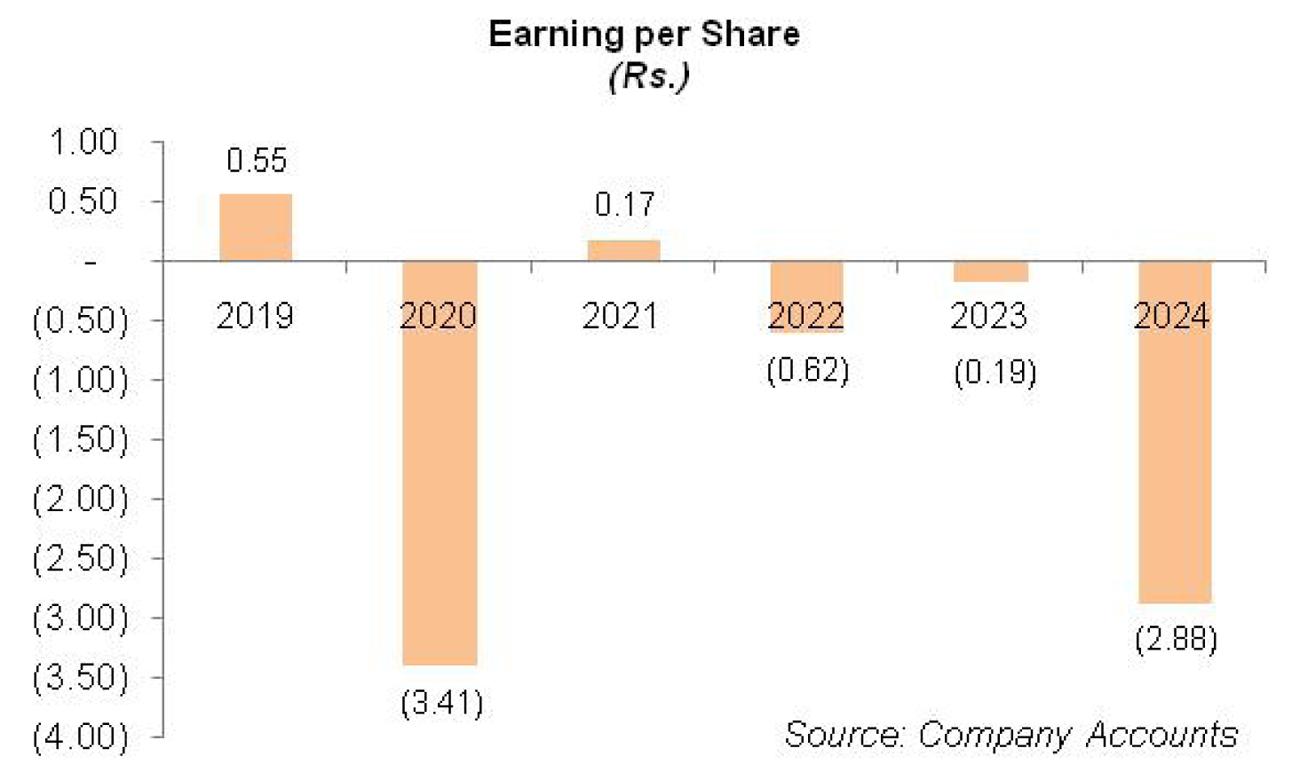
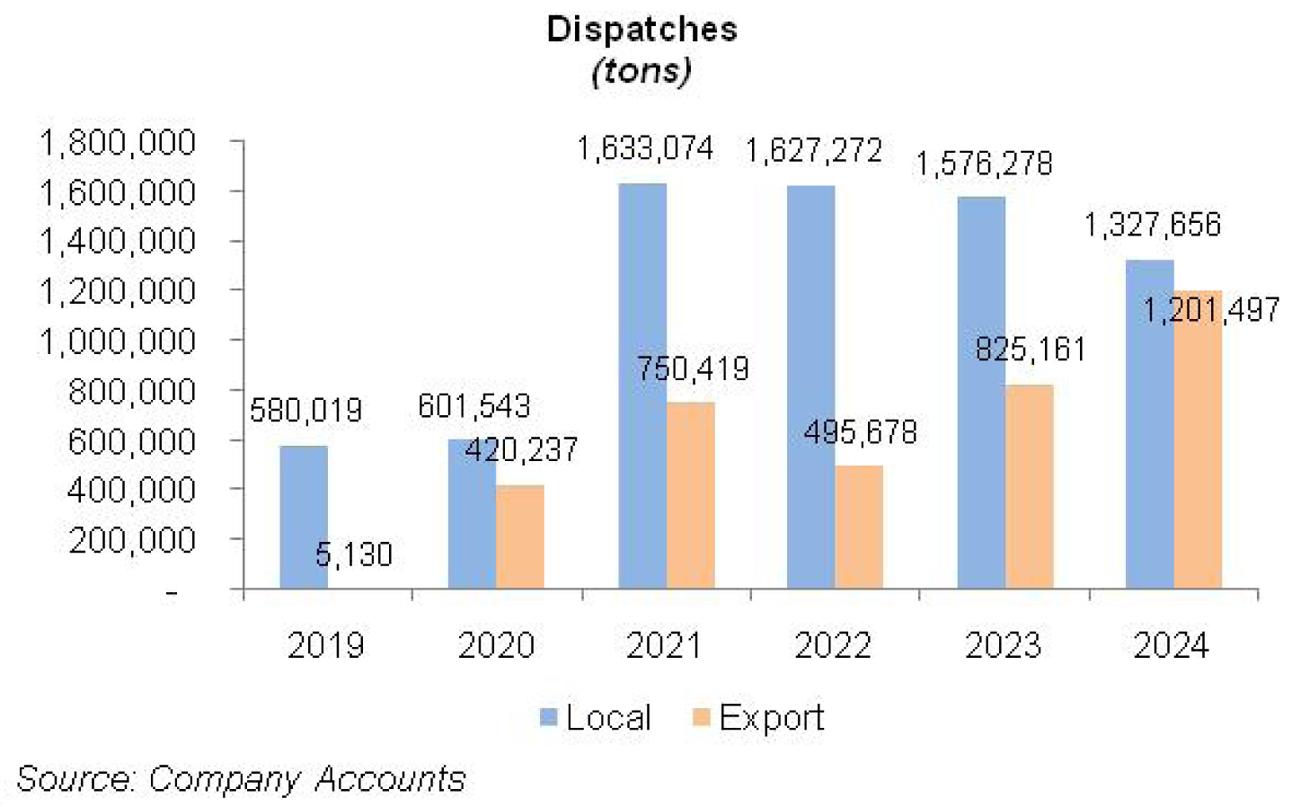
In 2020, POWER’s net sales posted a year-on-year uptick of 6.61 percent to clock in at Rs.4113.35 million. While local dispatches posted a marginal increase of 3.71 percent in 2020, export sales mounted by a massive 8091.75 percent in 2020 (see the graph of dispatches). This translated into 74.62 percent growth in the total dispatches of the company which stood at 1.022 million tons in 2020. The company shut down its old plant and its new 7700 TPD plant became operational midway through the year. The cost of sales surged by 14.28 percent in 2020 due to higher fuel charges, packing material charges, and transportation costs due to the implementation of the axle load regime. POWER posted a gross loss of Rs.116.17 million in 2020 versus a gross profit of Rs.157.28 million registered in the previous year. Distribution expenses surged by 248.35 percent in 2020 due to a spike in export expenses on account of increased export dispatches. Payroll expenses of the sales force as well as incentives and commission on local sales also contributed to driving up the distribution expenses in 2020. Administrative expenses escalated by 33.33 percent in 2020 due to higher payroll expenses on account of inflationary pressure as well as expansion in the workforce from 360 employees in 2019 to 493 employees in 2020. Other expenses multiplied by 87.50 percent in 2020 due to exchange loss incurred during the year. Gain on disposal of fixed assets resulted in a staggering growth in other income during 2020, however, it couldn’t offset the gigantic other expenses recorded during the year. Besides, loss allowance on trade receivables also mounted by a massive 1014.85 percent in 2020. Resultantly, the company posted an operating loss of Rs.988.23 million, up 285.5 percent year-on-year. Finance costs spiked by 1808.752 percent in 2020 due to increased borrowings obtained during the year. This resulted in a gearing ratio of 74 percent in 2020 versus a gearing ratio of 65 percent recorded in 2019. POWER posted a net loss of Rs.3621.629 million in 2020 with a loss per share of Rs.3.41. This was against the net profit of Rs.582.106 million and EPS of Rs.0.55 registered by the company in 2019.
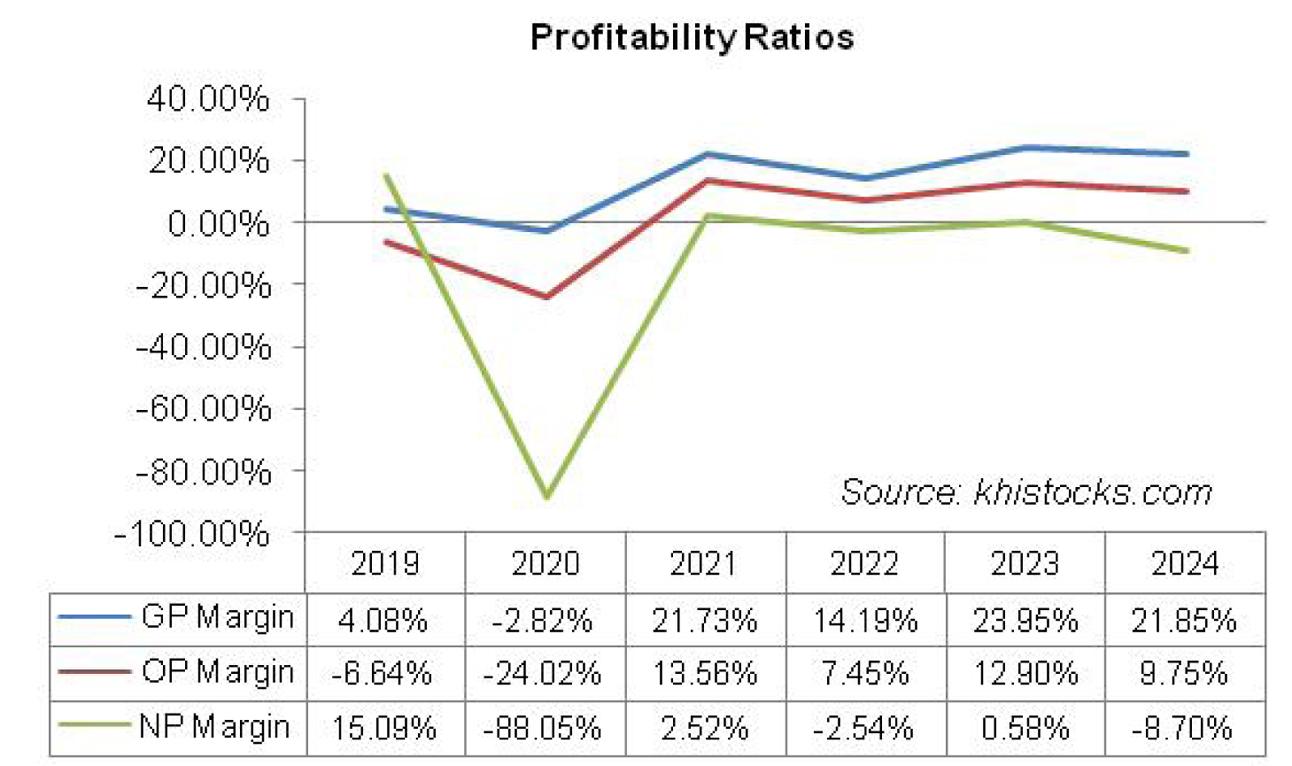
In 2021, POWER posted a staggering year-on-year growth of 245.72 percent in its topline which stood at Rs.14220.61 million. During the year, the company’s local sales volume grew by a massive 171.48 percent coupled with 78.57 percent growth recorded by its export dispatches. This translated into a growth of 133.27 percent in the overall dispatches of POWER which stood at 2.38 million tons in 2021. During the year, the government announced construction packages and low-cost housing schemes which coupled with a lower interest rate backdrop buttressed the cement industry sales volumes. The company operated its new plant at 101 percent capacity in 2021Export prices remained under pressure due to increased competition. Conversely, higher demand in the local market resulted in upward movement in the retention prices during the year which offset the impact of skyrocketed coal prices; transportation costs as well as electricity tariffs resulted in a gross profit of Rs.3089.64 million in 2021. This culminated in a GP margin of 21.73 percent in 2021. Selling & distribution expenses multiplied by 180.30 percent in 2021 on the back of elevated export expenses and advertisement expenses incurred during the year. Administrative expenses mounted by 33.77 percent in 2021 due to higher payroll expenses, legal & professional charges, repair & maintenance charges as well as fee & subscription charges incurred during the year. Other expenses tumbled by 88.88 percent in 2021 as the company didn’t incur any exchange loss during the year owing to stability in the value of local currency. Other expenses were conveniently offset by 344.27 percent growth posted by other income on account of hefty exchange gain. Charge on loss allowance on trade debts also slid by 45.89 percent in 2021. POWER posted an operating profit of Rs.1928.23 million in 2021 with an OP margin of 13.56 percent. Finance costs dropped by 12.73 percent in 2021 due to monetary easing. Net profit was recorded at Rs.358.36 million in 2021 with EPS of Rs.0.17 and NP margin of 2.52 percent.
In 2022, POWER’s net sales picked up by 23.025 percent to clock in at 17,494.88 million. This was merely the effect of higher retention prices as both local and export sales volumes declined by 0.36 percent and 33.95 percent respectively in 2022. Overall sales volume shrank by 10.93 percent to clock in at 2.12 million tons in 2022. This was due to a drastic increase in the cost of production – coal, electricity, packing, and transportation. Besides, the onset of monetary tightening coupled with high inflation marred the industry volumes. Cost of sales escalated by 34.87 percent in 2022, resulting in a 19.66 percent slump in gross profit. GP margin dived down to 14.19 percent in 2022. Selling & distribution expenses dwindled by 19.22 percent in 2022 due to lower export expenses and a cut in the advertisement and promotion budget. Administrative expenses ticked up by 12.59 percent in 2022 due to higher payroll expenses on account of inflationary pressure. The exchange loss incurred by the company during the year was offset by a gain recorded on the modification of the long-term trade payables contract with CEEC Tianjin (Pakistan) Electric Power Construction (Private) Limited. The revised amount payable by POWER was discounted at the market rate of 12.96 percent resulting in a gain that was recorded as other income. During the year, the company recorded a reversal of loss allowance worth Rs.36.28 million on trade payables. Operating profit eroded by 32.36 percent in 2022, resulting in an OP margin of 7.45 percent. Finance costs inched up by only 1.36 percent in 2022 despite a higher discount rate. This was due to the settlement of short-term loans during years which resulted in a gearing ratio of 57 percent in 2022 versus a gearing ratio of 72 percent recorded in 2023. POWER posted a net loss of Rs.443.946 million with a loss per share of Rs.0.62 in 2022.
In 2023, POWER’s net sales rebounded by 65.415 percent to clock in at Rs.28,939.10 million. Fall in construction activity due to high inflation, Pak Rupee depreciation, soaring interest rates, and political instability resulted in lackluster local sales which posted a year-on-year decline of 3.13 percent in 2023. Conversely, export sales strengthened by 66.47 percent in 2023. Export dispatches provided impetus to the overall sales volume of the company which picked up by 13.12 percent to clock in at 2.40 million tons in 2023. Higher retention prices also saved the day for POWER resulting in a 179.29 percent enhancement in its gross profit. GP margin attained its optimum level of 23.95 percent in 2023. Higher export sales resulted in a 102.985 percent surge in distribution expenses in 2023. Administrative expenses mounted by 28 percent in 2023 due to higher salaries & wages on account of inflationary pressure as well as workforce expansion from 500 employees in 2022 to 505 employees in 2023. POWER incurred a massive exchange loss of Rs.1023.93 million in 2023 which offset its petite other income. Nonetheless, operating profit grew by 186.16 percent in 2023, resulting in an OP margin of 12.90 percent. Finance cost multiplied by 44.72 percent in 2023 owing to a higher discount rate and increased short-term borrowings. POWER posted a net profit of Rs.168.993 million in 2023 with an NP margin of 0.58 percent. After adjusting for cumulative preference share dividends of Rs.378.772 million, the company recorded a loss after tax of Rs.209.779 million in 2023. This translated into a loss per share of Rs.0.19 in 2023.
In 2024, POWER posted year-on-year growth of 7.39 percent in its topline which stood at Rs.31,077.21 million. Local sales continued to slide posting a 15.77 percent decline in 2024. Conversely, export sales mounted by 45.61 percent in 2024. Overall dispatches grew by 5.32 percent to clock in at 2.53 million tons in 2024. As the local economy came to a standstill due to exorbitant levels of inflation, discount rate, energy tariff, and Pak Rupee depreciation which was further exacerbated by political instability, cement companies found safe haven in export sales to utilize their idle capacities. During the year, POWER operated at 71 percent capacity versus capacity utilization of 72 percent recorded in the previous year. This translated into production of 2.285 million tons in 2024. Higher retention prices, better absorption of fixed cost, and use of alternate energy resulted in a slight downtick in GP margin despite excessive cost pressure. GP margin was recorded at 21.85 percent while gross profit inched down by 2 percent in 2024. Hefty export expenses on account of higher export dispatches resulted in a 61.97 percent spike in distribution expenses in 2024. Administrative expenses also escalated by 20.42 percent in 2024 due to higher payroll expenses. This was the consequence of inflationary pressure as the company streamlined its workforce to 490 employees in 2024. Other expenses subsided by 82.42 percent in 2024 due to a breather in exchange loss as local currency began to show resilience towards the end of the year. Operating profit nosedived by 18.85 percent in 2024 with OP margin ticking down to 9.75 percent. Finance costs enlarged by 29.76 percent in 2024 due to a higher discount rate. The gearing ratio stood at 53 percent in 2024 versus the gearing ratio of 57 percent recorded in 2023. POWER posted a net loss of Rs.2703.284 million in 2024. This translated into a loss per share of Rs.2.88 in 2024.
Recent Performance (1HFY25)
POWER’s topline which had been showing resilience of late by off-loading its excess stock in the export market faced a setback during the first half of FY25 as its export dispatches slid by 34.79 percent to clock in at 468,199 tons. This was alongside a 4.65 percent decline in local dispatches which stood at 640.038 tons in 1HFY25. Overall dispatches posted a year-on-year decline of 20.23 percent to clock in at 1.11 million tons in 1HFY25. This was evident in the topline of POWER which plunged by 17.96 percent in 1HFY25 to clock in at Rs.13,822.10 million. During the period under consideration, POWER operated at a capacity of 68 percent versus a capacity utilization of 76 percent recorded in 1HFY24. Improved pricing, cost optimization, and a drop in power cost due to a decrease in some surcharges levied by the government resulted in an improvement in GP margin which stood at 27.11 percent in 1HFY25 versus GP margin of 23.71 percent recorded in 1HFY24. This was despite a 6.2 percent downtick recorded in gross profit in 1HFY25. Lower sales volume resulted in a 10.77 percent drop in distribution expenses in 1HFY25. Conversely, administrative expenses hiked by 32.57 percent in 1HFY25 due to inflationary pressure. POWER recorded net other income of Rs.26.29 million on account of exchange gain and re-measurement gain recorded in 1HFY25 versus exchange loss and re-measurement loss recorded during the same period last year. Operating profit ticked up by 8.81 percent in 1HFY25 with OP margin clocking in at 15.22 percent versus OP margin of 11.48 percent recorded during the same period last year. Finance costs plummeted by 25.5 percent during the period due to a reduction in the discount rate and contribution from sponsors. POWER recorded a net profit of Rs.32.27 million in 1HFY25 versus a net loss of Rs.469.817 million recorded in 1HFY24. After the adjustment of the cumulative preference shares dividend, the company posted a loss after tax of Rs.164.637 million in 1HFY25. This translated into a loss per share of Rs.0.15 versus a loss per share of Rs.0.64 recorded in 1HFY24.
Future Outlook
Although the company posted lackluster volumes in 1HFY25, local sales volume began to gain momentum in the second quarter of FY25 owing to the stabilization of macroeconomic indicators. Cement demand may pick up further in the 2HFY25 as the government is actively working to enhance activity in the infrastructure and housing sectors. Stable local currency, the decline in coal prices, and enhanced focus on the usage of alternate fuel may also contribute to better margins. Recently cement prices have portrayed a plunge from its peak of over Rs.1400 per bag to boost demand. If the trend continues, it will be well received by the market; however, the cement manufacturers will have to go the extra mile to maintain their margins.


Comments
Comments are closed for this article.