


Fauji Fertiliser Company Limited (PSX: FFC) is a public limited company that was incorporated under the Companies Act, 1913 (now Companies Act, 2017). It manufactures, purchases and markets fertilisers, and chemicals. It also has investments in other fertilizer, chemical, cement, energy generation, food processing and banking operations.
Shareholding pattern

As at December 31, 2021, over 44 percent shares are held under the associated companies, undertakings and related parties that includes Fauji Foundation and Committee of Admin. Fauji Foundation. The local general public owns nearly 24 percent shares, followed by over 11 percent held in public sector companies and corporations. The directors, CEO, their spouses and minor children own less than 1 percent shares, while the remaining 20 percent shares are with the rest of the shareholder categories.
Historical operational performance
The company has mostly seen a growing topline with the exception of a few years when it contracted. Profit margins in the last six years have been on a gradual upward trajectory.
Revenue in CY18 posted a growth of nearly 17 percent to reach almost Rs 106 billion due to a recovery in selling prices of urea. The market conditions for the same were rather dampened in the last two years. Thus, gross margin grew to 26.4 percent from last year’s almost 20 percent. While net margin also improved year on year from 11.8 percent in CY17 to 13.6 percent in the current period, the change was not as pronounced since other income that provided significant support to the bottomline last year as it was recorded at over Rs 10 billion, fell to Rs 6.3 billion in CY18. The reduction in other income was largely due to government subsidy dividend from AKBL.

In CY19, revenue contracted marginally by less than 1 percent. This can be attributed to low demand as Urea off take was lower by 2 percent while DAP off take stood at 237,000 tonnes compared to 480,000 tonnes in the previous year. However, as production cost declined to nearly 71 percent, gross margin improved to 29 percent. This also trickled down to the net margin that was recorded at a higher 16 percent as other income grew to over Rs 7 billion from last year’s Rs 6.3 billion. This was sourced from income from conventional banks and dividend income from conventional mutual funds.

Topline contracted once again in CY20 by 7.7 percent due to a decrease in selling prices of Urea. The latter was a result of a reduction in GIDC rates. While DAP off take remained subdued as it was lower by 2 percent due to limited product availability, Sona Urea had in fact increased to 2,512 thousand tonnes. With production cost continuing to fall, reaching 67.7 percent of revenue, gross margin rose to over 32 percent. This also trickled to the bottomline that grew to nearly Rs 21 billion, while net margin stood at over 21 percent. Additionally, bottomline was supported by an Rs 5.9 billion gain on extinguishment of original GIDC liability.

Revenue growth in CY21 bounced back as it was posted at over 11 percent for the year with topline reaching a high of over Rs 108 billion. While sales revenue from manufactured urea grew by a marginal 2.5 percent, the same from purchased and packaged fertilisers grew by 50 percent. It must also be noted that international prices for both Urea and DAP increased significantly. Thus, the higher revenue reflected in the gross margin that was recorded close to 36 percent. While this also trickled to the operating margin, however, net margin was lower, albeit marginally, at 20 percent as gain on extinguishment of original GIDC liability that was seen last year, was entirely absent in the current period. Instead, the company incurred Rs 2.4 billion expense in unwinding of GIDC liability.
Quarterly results and future outlook
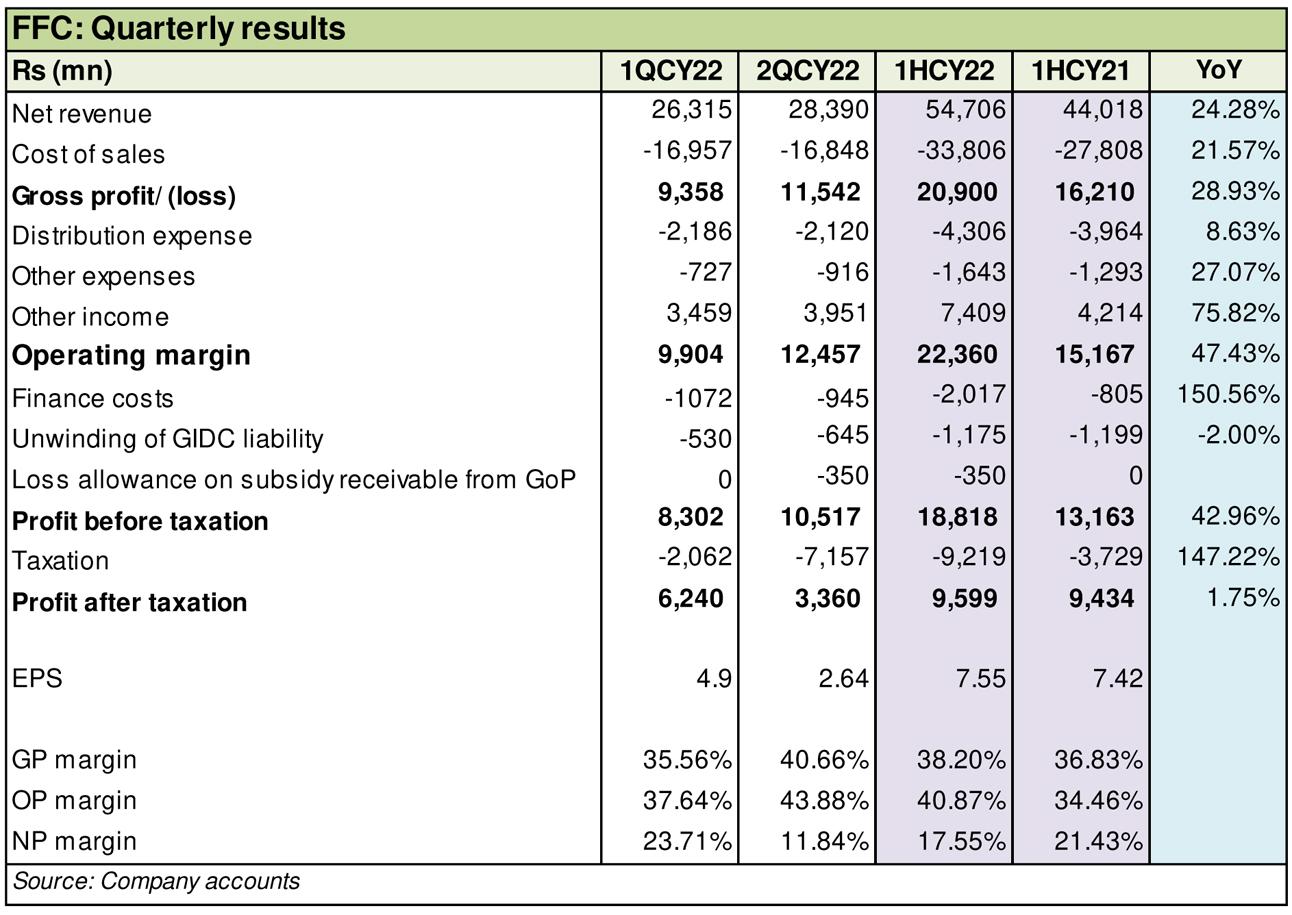
In the first quarter of CY22, revenue was higher by almost 22 percent year on year. This was attributed to a combination of Sona Urea off take that was recorded at 631,000 tonnes and DAP prices. The increase in Urea sales was a result of higher urea availability as well as demand. However, this did not translate into higher profitability as production cost rose to consume over 64 percent of revenue compared to nearly 61 percent in the same period last year. This was due to higher marketing of urea and in addition to increased costs of imported DAP. Thus, net margin was lower at 23.7 percent versus nearly 27 percent in 1QCY21.
The second quarter of CY22 was again higher year on year, at over 26 percent. This was again attributed to an increase in demand that resulted in Sona Urea off take of 1,275,000 thousand. Additionally, higher prices of imported fertilizers also contributed to the improved revenue. With notably lower production cost at 59 percent of revenue, gross margin was better at 40.6 percent versus 34.7 percent in 2QCY21. While net margin at 11.8 percent versus 16 percent in 2QCY21, was impacted by the incurrence of super tax enacted by the Finance Act 2022, profit before tax was significantly better in 2QCY22 at Rs 10.5 billion compared to Rs 5 billion in 2QCY21. The production and/or availability of fertilizer directly impact the food security of the country as it affects the crop yields. In addition to this, uncertainty on the economic and geopolitical front also poses challenges for the company.


Comments
Comments are closed for this article.