


There are two ways to look at growing petroleum sales in Pakistan. The rising consumption of petroleum products indicate rising demand which is fueled by many factors such as rising auto sector sales, improving industrial and manufacturing activity, higher agricultural activity, better control of smuggling through borders as well as economic activity. At the same time rising petroleum consumption in the country also means higher imports of the same, which make a significant portion of the total. Higher imports of crude and petroleum products, which have been over 8 percent in FY21, along with rising inflation fuel the current account deficit.
A look at last six years show that up until FY17, petroleum consumption in the country was growing and the pace really picked up after FY13 as rise in demand by the power sector, increased infrastructure and development activity, growing car sales and an overall increase in economic growth along with lower prices triggered volumetric sales by the oil marketing companies. However, the pace slowed down beyond that with the change of the government as prices rose and economic activity entered a standby mode during the election year. Also, structural changes, reforms, a new IMF Programme and massive currency depreciation all slowed down economic activity that reflected in petroleum product consumption in the country. Also as CPEC entered the second phase, development and infrastructure activity slowed and government tried replacing FO with other imported/indigenous fuels like RLNG and coal, demand was affected, which was also reflected in otherwise robust petrol consumption.
Oil and petroleum consumption witnessed a sharp recovery in FY21 after a dip in pandemic hit FY20 due to rise in demand by the power sector as the hydel and RLNG generation remained subdued during the year. Petrol volumes were driven by the recovery seen after COVID lockdowns and restriction, and rising car sales. HSD volumes were spurred by industrial and agriculture growth as well as curb on smuggling.
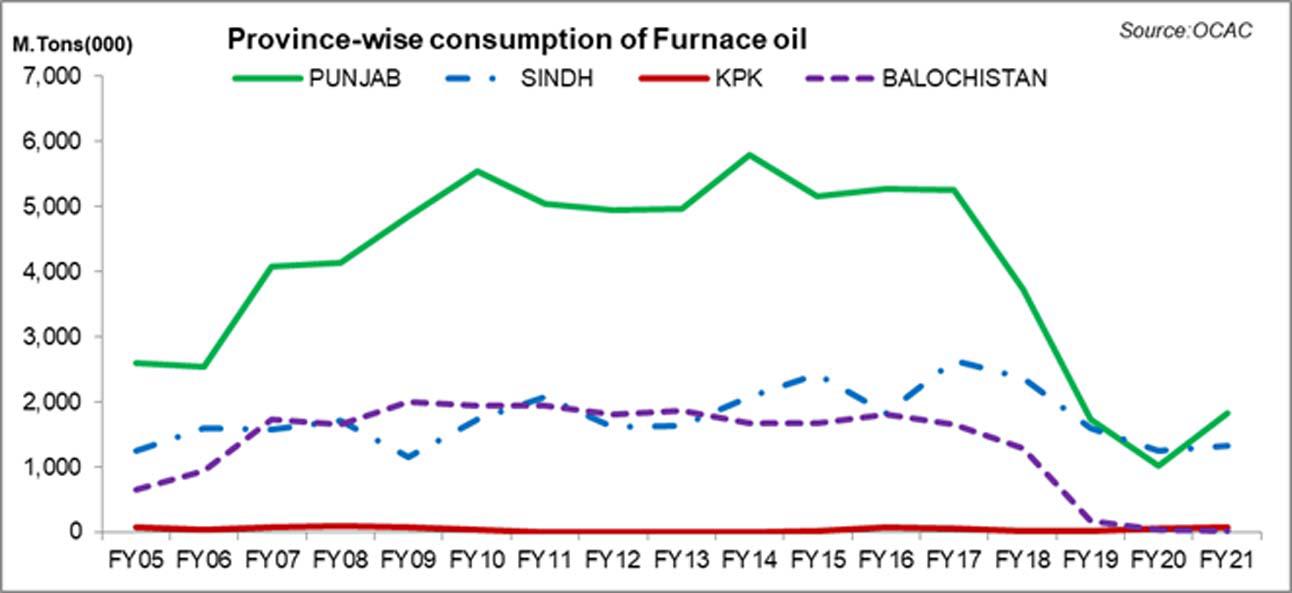
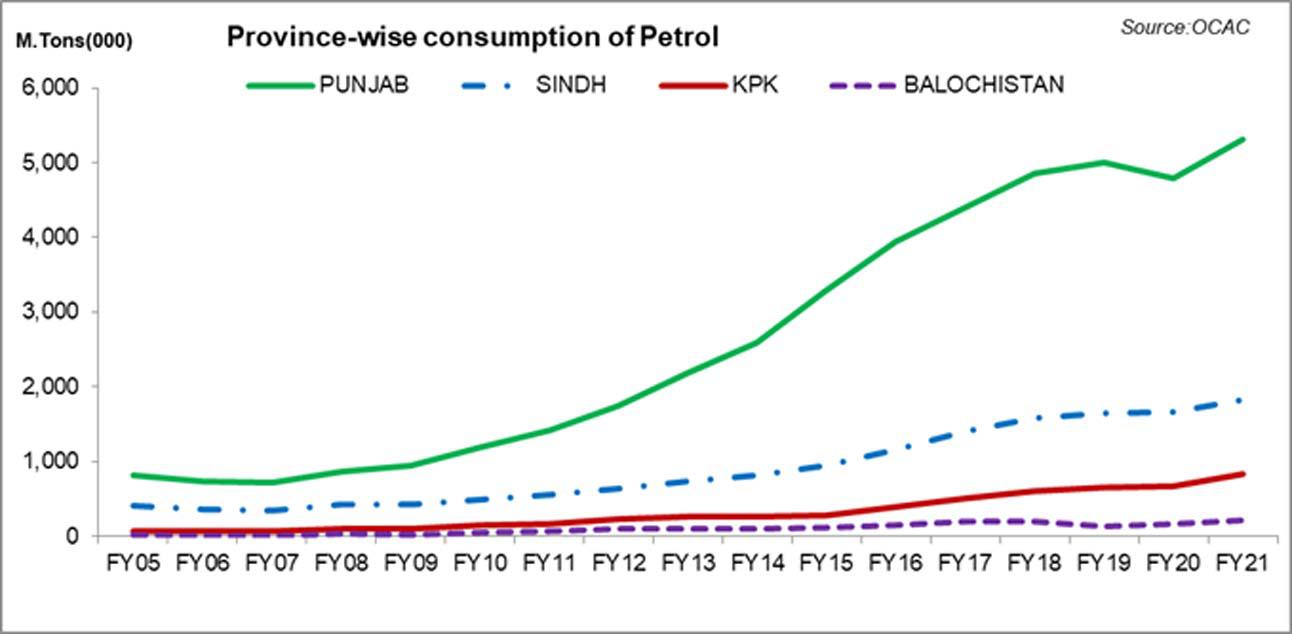
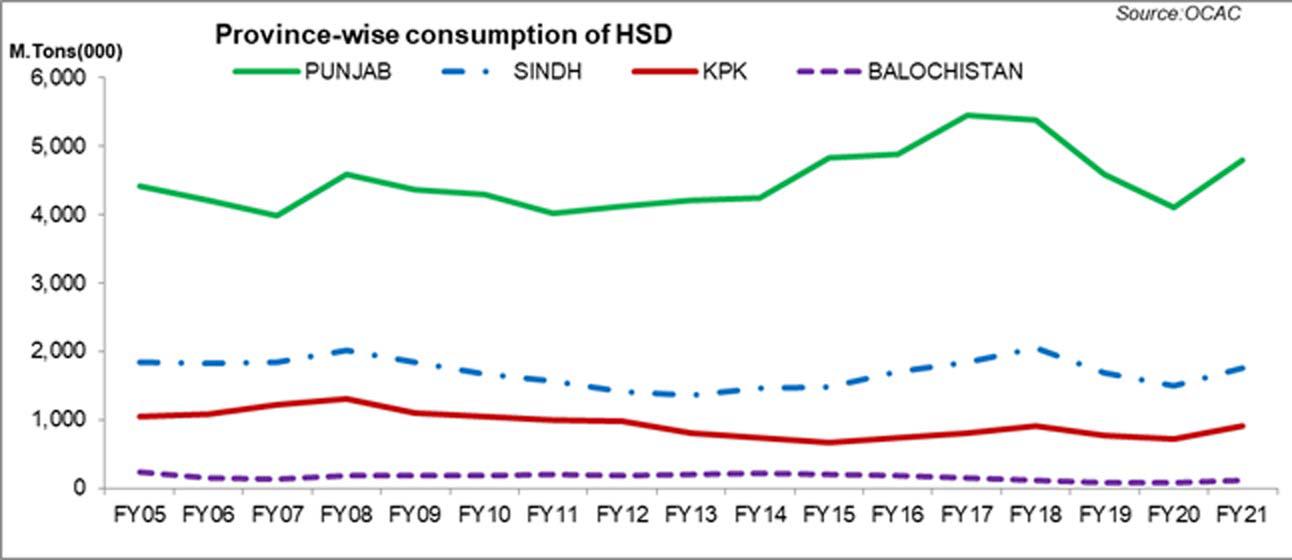
Parsing petroleum consumption by provinces show that bulk of the consumption continue to come from Punjab; its share has stood at 61 percent in FY21 in overall consumption that includes that include furnace oil, high speed diesel, motor spirit, JP-1, Kerosene, etc. – data from OCAC shows. Product wise, FO’s rising trend can also be seen in Punjab’s rebound in fuel’s share where its share stood at 43 percent in FY20 and 56 percent in FY21. Its share in petrol consumption has increased from around 60 percent in FY05 to over 63 percent in FY21. For HSD, Punjab accounted for 61 percent in FY21 versus 57 percent in FY05.


Comments
Comments are closed for this article.