


Ghani Global Glass Limited (PSX: GGGL) was set up in 2007 as a private limited company under the Companies Act, 2017. It is part of the larger Ghani Global group of companies, that also includes Ghani Chemicals and Airghani.
Ghani Global Glass manufactures and sells glass tubes, glass ware, vials and ampules.
Shareholding pattern

As at June 30, 2020, over 52 percent shares are owned by joint stock companies, followed by nearly 39 percent held by individuals. Close to 4 percent shares are held in funds, provident funds, mutual funds, and pension funds. The directors, CEO, their spouses and minor children own a little over 1 percent shares while the remaining roughly 3 percent shares are owned by the rest of the shareholder categories.
Historical operational performance
The company’s topline has grown consecutively since FY17, and profit margins have also followed a similar trend.

In FY16, the company had set up its new glass tubing plant, with technological supervision from European experts; it has been the first one to do so. The company claims that its product is an import substitute and faces competition from cheaper Chinese products. Commercial production did not begin until the last quarter of FY16. Therefore, the revenue in FY17 saw an unprecedented increase, from Rs 66 million in FY16 to Rs 330 million in FY17. Given that FY17 was only the first complete year of production, its cost of production stood at 96 percent, leaving little margin for absorption of other costs. Therefore, the company’s net loss was recorded at Rs116 million.

As the market gradually accepted the company’s products, the sales of the company picked up. This is reflected in the 50 percent growth in revenue in FY18, nearing Rs 0.5 billion. But production cost grew further to claim over 98 percent of revenue, escalating losses to Rs 123 million for the period. This was because the company is manufacturing a premium quality product that is competing with low-cost Chinese substitutes. Therefore, despite incurring high costs to ensure quality, it could not charge a premium price, in order to capture market share. In addition, the industry is also power intensive to a certain extent. Thus, the rise in energy and fuel expenses also contributed to a negative bottomline, in addition to currency depreciation that led to an exchange loss of Rs 4.2 million, compared to almost Rs 1 million in the previous year.
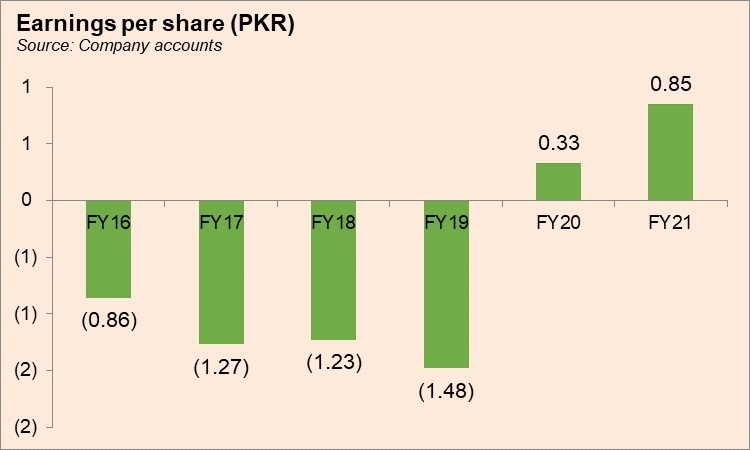
FY19 saw nearly 60 percent growth in topline, as acceptability for the company’s products grew. During the year, the company “technologically upgraded the furnace design from natural gas firing to oxygen enriched combustion with the coordination of European professionals”; this helped to improve quality of glass and dimensional efficiencies. On the other hand, production cost reduced as a percentage of revenue although it was still beyond the 90 percent mark, at over 93 percent of revenue. Finance expense continued to rise as a percentage of revenue due to a high discount rate. Thus, the company incurred a loss of Rs 148 million; as a percentage of revenue however, that is, net margin was improved at a negative 18.7 percent, compared to a negative 24.8 percent in FY18.

Growing by nearly 64 percent, revenue crossed the Rs1 billion mark in FY20, despite the slow economic activity in the first half of FY20, and the second half being impacted by the outbreak of the Covid-19 pandemic. During the period, the company added 20 more customers, taking the total count to 80 pharmaceutical companies to which it supplies ampoules and vials. The company also undertook cost cutting measures which is reflected in the production cost dropping to nearly 78 percent of revenue, thereby allowing gross margin to jump to 22 percent. this also trickled down to the bottomline, as is seen by a positive profit figure of Rs 40 million and a net margin of 9.5 percent. The company posted a positive profit figure for the first time since FY16.
Recent results and future outlook
The first quarter of FY21 saw revenue higher by nearly 21 percent year on year. This was primarily due to a rise in exports which were nil at the same period last year as economic and business activities picked up after the easing of lock downs. Production cost improved as a percentage of revenue allowing for higher profitability. The second quarter also saw higher revenue year on year by 24 percent, with production cost significantly lower year on year. This also trickled down to the bottomline as is evident by the 16.5 percent net margin compared to 1.4 percent seen in 2QFY20.

Revenue was lower in the third quarter of FY21 by over 16 percent year on year. While local sales remained almost similar, export sales reduced considerably, from almost Rs 63 million in 3QFY20 to Rs 8.6 million in 3QFY21. But due to a notable rise in administrative expense, the higher gross margin was offset, therefore, net margin was lower year on year; at less than 1 percent, net margin was also the lowest among the four quarters of FY21. The last quarter saw the highest revenue as well as the highest production cost. But this was offset by a control on administrative expense and a lower finance expense, allowing for an improved bottomline. The company is planning to set up a new furnace and undertake BMR activities to enhance capacity and diversify. Thus, with enhanced capacity, the company foresees higher profitability.


Comments
Comments are closed for this article.