


FY21 was one of the better years in terms of managing current account deficit while bringing the growth momentum back. The deficit stood at $1.85 billion (0.6% of GDP) – lowest in ten years. However, signs of a growing current account deficit are becoming visible. The deficit in the last two months stood at $2.3 billion (4.6% of GDP); it was $1.6 billion (6.5% of GDP) in June. There are some one-offs in June; but barring that, the deficit is still at an uncomfortable level. A manageable deficit for FY22 could be at 2-2.5 percent of GDP – or on average $500-700 million per month. Anything higher should be managed through policy measures.

There was surplus in the current account in the first ten months of the year and that was primarily due to exceptionally high remittances, low services imports, lower petroleum imports, and slightly better exports. The first three indicators were better due to low travel due to covid-related restrictions, but any further improvement in these is limited. Rather, there are risks of services imports bouncing back and remittances remaining flat, if not starting to fall. The potential in the growth of exports is also limited in the next year or so. The key is to manage imports.

Interestingly, the imports in FY21 are still shy of the highest level achieved during FY18 – based on SBP data, imports are 3 percent lower than FY18 highest levels at $53.8 billion. Lady luck was with Pakistan in FY21 as oil prices on average were 15 percent lower than the levels in FY18 – down from $63.6/barrel to $54.1/barrel. That is why petroleum imports were 27 percent or $3.5 billion lower in FY21 as compared to FY18.

That benefit is eroding fast. In June, oil averaged at $73.1/barrel and petroleum imports stood at $1.2 billion which is 58 percent higher than average monthly imports in the first eleven months. With oil prices likely to hover around $70/barrel in the next few months or quarters, the oil imports will remain high as not only price is increasing but consumption – both in transportation and power generation, is growing.
It is time for SBP and MoF to introspect on the elements of imports in FY21 which were not significant in FY18. On top of that list is food imports – up by 32 percent from FY18 to stand at $7.2 billion. It is by far the highest food imports in any year both in terms of value and percentage of GDP. There are wheat and sugar imports and the question is, are these one-offs? Palm oil is the biggest food import component and here higher prices are resulting in higher value. This may normalize over the next cycle. Similar is the case of pulses and probably of other food items. Nonetheless, the government should seriously think on breaking palm oil import lobby and start local production. And should also think on a strategy to flip overall the food trade balance. Food trade deficit stood at $2.7 billion in FY21 which is manifold of previous 19- year average of $476 million.
In FY18, machinery imports were peaking – at $8.8 billion ($8.0 bn barring mobile phone). The number in FY21 stood at $8.3 billion ($6.2 bn barring mobile phones). It is better to analyze machinery imports without mobile phones as it is mainly a consumption item. The toll in FY21 is 23 percent lower than that in FY18. That is mainly due to less power generation and electrical machinery imports as in FY18 and FY19 power sector new plants were coming online at a grater pace. That number will remain low. However, in June 21, the power generation machinery imports stood at $150 million which is double of FY21 monthly average – this could be due to imports in solar panels as well.

In FY22, due to TERF and other expansion plans, machinery imports may pick up. Already there are signs of higher textile machinery imports in FY21. That is healthy but will put a strain on the import bill. The growing imports are of mobile phones – up by 67 percent or $1.2 bn from FY18 levels to $1.9 billion in FY21. This is due to some organic growth and largely attributed to having all phones imported at real value. Going forward, majority of these phones will be assembled in Pakistan; but SKD/CKD imports of phones –which are inputs to mobile phone assembly—will likely remain high.
Transport imports in FY21 are yet to reach the level of FY18 – down by 14 percent or $461 million to $2.7 billion. This is likely to increase in FY22 as not only automobiles sales are growing due to economic bounce back but lower taxes in the budget are likely to boost demand too. The story of metals and other groups is similar where the output is reaching at the level of FY18 and will grow in FY22. The new items – like phones, food, and other elements, will pinch more as other imports will no longer remain low. Plus, all the commodities prices are higher and that will strain the imports bill unless price direction reverses.
In a nutshell, imports are likely to remain high. In June-21, based on SBP data, imports at $6.3 billion is highest ever and barring one -offs – like higher defense related bunching imports in the end of year, the bill is likely to hover around $5.5-5.8 billion a month provided oil prices remain around $70/barrel. In June, there were COVID vaccine imports of $103 million and that number will remain around $100-150 million a month for this year.
Seeing imports rigidity and connection to economic growth, it is imperative to boost exports and remittances. Exports in FY21 stood at highest ever number at $25.6 billion. Textile exports at $14.4 billion is the highest ever – up by 13 percent YoY. Similar is the story of other manufacturing group exports – up by 9 percent to $3.8 billion. Dismal performance is visible in food exports – down by 1 percent. Food (or agriculture at large) is the weakest link. Nonetheless, in many sectors – especially textile, expansion is taking place and there is a good future for exports provided energy and other factors keep them competitive. But it will take its sweet time and imports are already peaking.
The trade deficit in goods stood at $28.2 billion – up by 33 percent YoY. Trade deficit in services is down by 43 percent to $1.8 billion. The better performance is due both exports growth (up by 9 percent – mainly in IT – up by 47 percent to $2.1 bn) and lower imports – down by 10 percent – due to less travel. With travel opening, the trade deficit is services may worsen too. Overall trade balance – goods and services, are worsened by 23 percent to $30.0 billion.
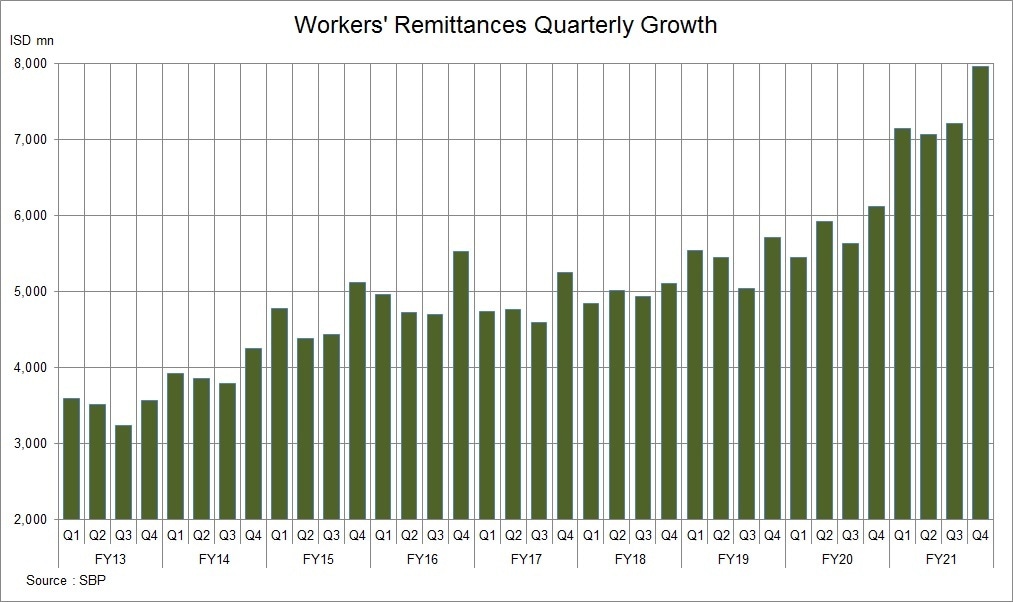
The real gain is coming from secondary import balance – up by 29 percent to $32.8 billion. The start performer is home remittances – increased by 27 percent to $29.3 billion. Enough has been said in the previous months’ current account commentary on remittances in this space. Shift of informal remittances to formal sector due to less travel is the prime reason for this growth. A similar momentum is seen in Bangladesh where the remittances growth outpaced Pakistan.
But this growth is unlikely to sustain during FY22. Exports will not grow at a pace fast enough to finance the growth in imports. The key then is to manage imports. The first line of defense is exchange rate – already depreciating and may fall further if imports do not come in control. In a few months, if current account deficit remains north of $700-800 million, SBP may have to raise policy rate to counter it. At the same time, SBP and government are finding new debt avenues – RDA, Euro bonds tap and to enhance bilateral debt (mainly by China) and multilateral debt to finance current account. For multilateral debt, bringing IMF programme back on track is imperative.


Comments
Comments are closed for this article.