The estimated GDP growth at 3.94 percent for FY21 has surprised many. There is no reason to not believe that perhaps the actual growth in industrial sector would be a little higher. The country has a record grain output this year. Rural income levels have generally improved and showing the wealth effect. Then the higher amount of disbursement through Ehsas programme is doing some demand magic. And the high remittances flows must have contributed to some demand.
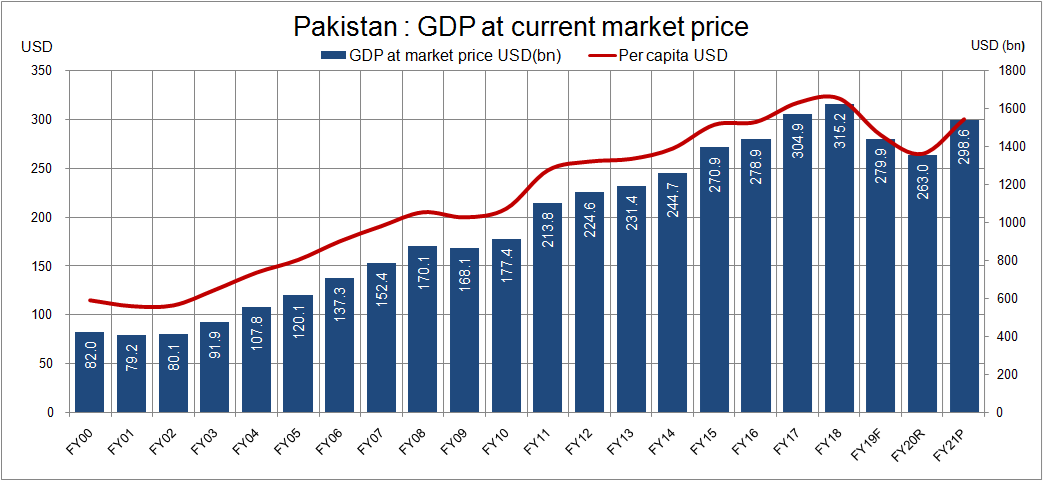
However, there’s nothing to be upbeat about this growth coming from a low base. The per capita income at $1,543 is still to reach the peak of $1,652 in FY18. The GDP in nominal terms at $298.6 billion is still shy of $315.2 billion in FY18. But that higher numbers in 2016-18 were also not sustainable as the currency was kept artificially overvalued to boost domestic demand. That had to unravel, and the GDP per capita went down to $1,361 in FY20.

The economy is catching up the growth trajectory after attaining stabilization. The next two years are aimed to be of higher growth. This may bode well for the well-being of average household. The momentum is building. But there still is inertia in the economy. The output gap is still negative, and, in a few sectors, economy has yet to reach the production levels of 2018. However, the structural reforms and quality of growth is imperative to not get back into another balance of payment crisis within the next 2-3 years.
In FY21, the surprising element is of higher growth in wholesale and retail trade (within services sector) at 8.37 percent. The sector weight is 18.82 percent in GDP, and it contributes 40 percent (or 1.58 percentage points) of FY21 growth. This sub sector uptick is linked to better performance of crops output, upbeat growth in LSM and overall growth in trade volumes. The sum of imports and exports of goods are up by 17 percent in USD during 10MFY21. Then the wholesale and retail trade segment are growing from a low base – minus 3.94 percent in FY20 and mere 1.08 percent in FY19. However, higher growth is very much plausible in FY21.
Then the agriculture performance in grains – mainly wheat has surprised many. Earlier projection of SBP and others were based on the old data. According to sources, the latest data PBS received in May this year is showing better results and when these number are put in SBP and other models, the growth comes closer to what is estimated by the PBS. If the new grains numbers are true, then the requirement of wheat import should be siphoned off. The prices of wheat and maize (as it is also showing 7 percent plus growth) should stabilize as soaring prices are reflecting that demand is exceeding supply.
More than half of agriculture GDP is of livestock. It is estimated to grow at 3.06 percent. This growth is based on crude estimates as the census of livestock is pending. The growth is very much in line with the historic growth. There are no signs of any attempt to overstate the GDP by using subsectors including livestock, fishery, and forestry. The overall growth in agriculture is estimated at 2.77 percent in FY21 as compared to 3.31 percent last year.

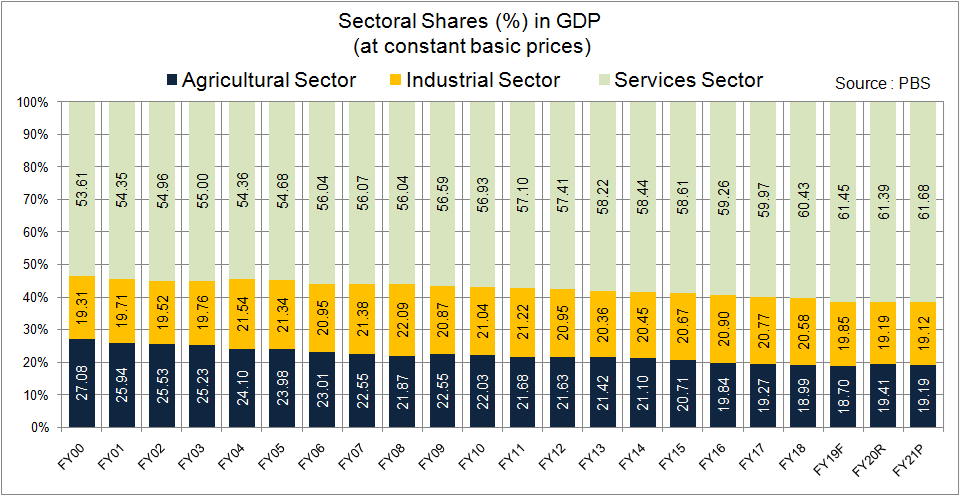
Industrial sector comprising of 19 percent of GDP is estimated to be up by 3.57 percent in FY21. This sector was adversely affected by the lockdowns in the fourth quarter of the last year – went down by 3.77 percent in FY20. This decline was in continuation to the fall of 1.56 percent in FY19 due to economic slowdown and stabilization policies.
In the previous five years (FY13-18), the industrial growth averaged at 4.9 percent. But within the exports, share was declining. Raw materials are mostly imported and with some value addition, the goods produced are consumed at home. The import-led manufacturing growth without boosting exports share had to slowdown. The good thing is that the exporting sector is now faring well. It is imperative for that trend to continue.
LSM growth is estimated at 9.29 from a fall of 10.12 percent last year. The LSM growth is 9MFY21 is at 8.99 percent. In March-21 it grew by 22.4 percent. April-June 2020 was the worst period due to lockdowns; so, the growth will be higher in the last quarter this fiscal year. Seeing this the LSM for FY21 is underestimated. And based on that the services sector growth is under-estimated too. This would surely more than offset the impact of over estimation (if any) in wheat production on services sector.

The growth in small scale and slaughtering are based on crude estimates and these are by no means are attempted to overestimate. For example, small scale manufacturing is up by 8.3 percent in FY21. This is in line with growth range of 8.2-8.7 percent during FY05-19 irrespective of volatile trajectory of LSM in the same period. In the last year it grew by mere 1.5 percent. It seems that small scale manufacturing growth is underestimated in FY21.
Services sector constitutes of 61.7 percent of GDP and it is estimated to grow by 4.4 percent in FY21 as compared to a decline of 0.55 percent last year. The highest growth (as mentioned above) is estimated in wholesale and retail trade. This is the highest growth since 2005-06. The sector is as big as agriculture. The impact of growth in major crops, LSM, external trade has a strong bearing on wholesale and trade.
The other area of higher growth within services is finance and insurance – up by 7.8 percent as compared to 1.1 percent last year. Its share is 3.72 percent in GDP, and its mainly banking. The remittances growth and stimuli offered by government and SBP have boosted the money supply, and more specifically the banking deposits. The commercial banks deposits grew by 16.4 percent during between April-20 to March-21. This growth is significantly higher than average deposits growth of 10.5 percent in the previous three years. The profitability of commercial banks is also depicting a similar story as the profits are up by 35 percent in 2QFY21 and 21 percent in 3QFY21.
Some say that due to COVID related smart lockdowns, there must be decline in many retailing services such as catering, marriage halls, restaurants, fashion, gyms and clubs, beauty parlors etc. No doubt these businesses remained slow in FY21, but interestingly many of these are not incorporated in the GDP. The GDP was last rebased in 2005-06 and at that time many of these services were extremely limited in Pakistan. The mushrooming growth in the last fifteen years is not really captured in current GDP estimation.
Pakistan overall nominal GDP is up by 14.8 percent to Rs47.8 trillion ($298.6 bn). The higher nominal growth would lower the fiscal deficit and public debts in terms of GDP. At the same time, the GDP rebasing exercise is due for long and is under process. The buzz is that the new series will be published within this calendar year. There are many sectors – within LSM and many in services are underreported in the ongoing base. Value addition in textile, packaging and many other sectors is not captured in LSM. As mentioned above, many modern services are not part of the GDP. For details read “Understated GDP”.
Nominal GDP is likely to increase by around 10-15 percent and that would take the number to somewhere between Rs52-54 trillion and that would improve the deficits and debt ratios. However, these will make the tax to GDP ratio even lower. The higher-than-expected growth in FY21 is questioning the performance of FBR as taxes growth should have been higher!


Comments
Comments are closed.