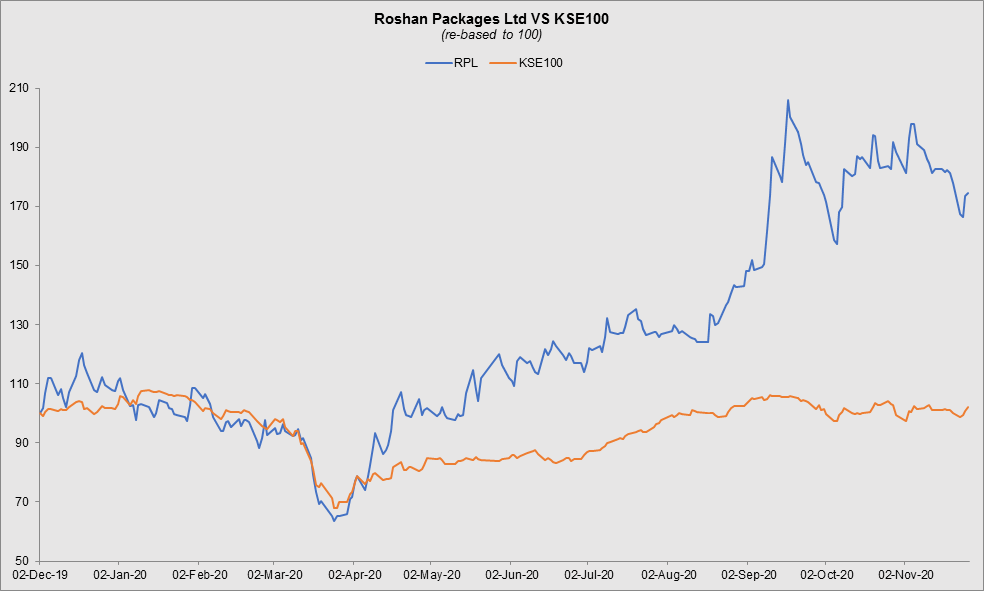
The history of Roshan Packages (PSX: RPL) goes back to 1959. It began its journey with the launch of Urdu Digest, later venturing into exporting fruits in 1989. The high-volume export demand generated the need for an in-house packaging unit that gave to the establishment of Roshan Packages Limited in 2002.
Currently Roshan Packages specializes in co-extruded films, flexible packaging and corrugated packaging materials and solutions.
In 2011, it further expanded within the packaging industry by investing in a European Flexible plant that caters to the FMCG sector. In 2017 it held an IPO that allowed for further development by investing in a BHS Corrugator.
Shareholding pattern
With 68 percent shares held under this category; directors, CEO, their spouses and minor children are the major shareholders of the company, as at June 30, 2020. Within this category, Mr. Tayyab Aijaz, the CEO of Roshan Packages, holds the largest number of shares, at nearly 27 percent. A little over 25 percent shares are with the local general public while the remaining around 7 percent are the rest of the shareholder categories.

Historical operational performance
In the last five years, Roshan Packages topline as well as profit margins have fluctuated. The latter fell until FY18, and have been rising since.

During FY16, topline increased marginally by a little over 1 percent. Given that fuel and energy costs as well as raw material expense was relatively lower during the year, cost of production made 86 percent of revenue, down from previous year’s 89 percent. This helped to raise gross margins, the effect of which was also reflected in the bottom-line as other elements of the financial statements also remained more or less similar year on year. Thus, net margin improved to 7 percent from 3.7 percent in FY15.
The company was incorporated as a “private company limited by shares”. In September 2016, i.e., at the end of the first quarter of FY17, it was converted into a public limited company and was listed on the country’s stock exchange by the third quarter of FY17.

During FY17, the company crossed Rs 4 billion in sales, growing its topline by 13 percent. Most of this increase was generated through volumetric gain as sales volumes grew by 17 percent. Cost of production rose marginally to 86.5 percent owing to higher depreciation as a result of installation of new plant and machinery. This led gross margin to reduce to similar effect. The increase in administrative and distribution expenses was compensated by other income to some extent which kept operating margin relatively stable, whereas higher mark up on long term loans cause net margin to reduce to 6 percent. The higher income arose out of profit on bank deposits coupled with gain on disposal of operating fixed asset.
There was a marginal decline in topline by 1.6 percent. Although topline declined, it still remained above the Rs 4 billion mark. On the other hand, cost of production increased significantly consuming 94 percent of the revenue – the highest seen in six years. This was due to increase in local raw material prices which in turn was a result of import restrictions and additional imposition of duties. This brought down gross margin to 6 percent while the increase in administrative expense due to higher salaries and fees and subscription expense, was offset by higher other income; the latter was a result of income from financial assets and “liabilities no longer payable written back”. The year eventually ended with a loss of Rs 91 million.

In FY19, the company witnessed its highest topline growth at nearly 34 percent, crossing Rs 5 billion in value terms; volumetric sales growth stood at nearly 19 percent. However, cost of production continued to consume more than 90 percent of the revenue that kept gross margin roughly around 6 percent. Distribution expense increased due to higher salaries expense, but it was also supported by higher other income coming from financial assets and gain on sale of property, plant and equipment. Finance cost, primarily related to short-term borrowings and a higher tax expense caused the company to post a loss for the second consecutive time of Rs 27 million, albeit lower than last year’s Rs 91 million.
Roshan Packages did relatively well in FY20. Topline contracted by 3 percent; in volumetric terms as well, sales reduced as the company sold 36,261 metric tons, compared to 39,536 metric tons in FY19. Cost of production fell to 89 percent of the revenue which created some room for absorption of overheads. Distribution and finance expense continued to incline, mainly due to transportation and freight and short-term borrowings, respectively. On the other hand, reduction in other expense helped to improve operating margin along with a positive tax figure that supported the bottom-line. Thus, after a period of two consecutive years of losses, the company recorded a positive net margin of 4.7 percent.

Quarterly results and future outlook
Revenue grew by 57 percent year on year during 1QFY21 as the company continued penetrate markets and expand their customer base. Cost of production at 87 percent was also contained in comparison to 91 percent seen in the same period last year. This helped to improve gross margins, the effect of which was also seen in net margin that was further improved due to lower finance expense; the latter was due to lower policy rate. Thus, net margin for the quarter was 5 percent.

The risks that the company faces currently is that of supply chain disruption in light of the second wave of the coronavirus, in addition to inflation, while lower policy rate brings some stability to the equation.


Comments
Comments are closed.