

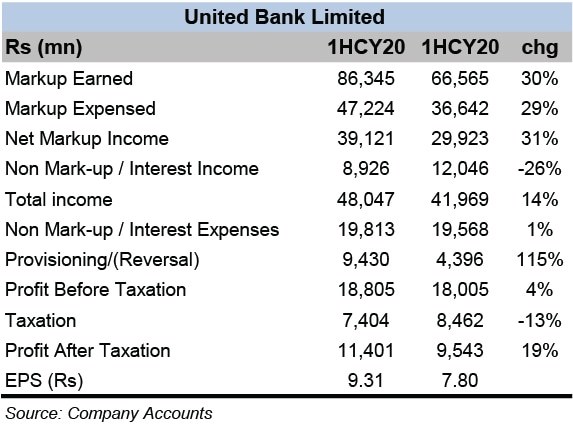
Strong and consistent balance sheet growth helped UBL consolidate its position further, as the half year financial results show solid growth in all profitability indicators. The net markup income posted a strong 31 percent year-on-year growth – at the back of a solid 12 percent growth year-on-year in average interests earning assets at Rs1.6 trillion.
The advances portfolio fell as economic activity remained subdued during the period especially due to Covid-19. The bank level performing advances averaged 5 percent lesser year-on-year at Rs599 billion. In line with higher prudence, UBL continued with its de-risking strategy of the international loan portfolio which went down by 29 percent year-on-year.
The investments stood at Rs1.02 trillion at the end of June 2020, having averaged a massive 37 percent higher year-on-year, at just a little under the trillion-rupee mark. Bulk of the investments were parked in government securities which yielded a highly attractive 11 percent yield during 1HCY20 – while the international bond portfolio returned a more modest yet stable 5.9 percent yield on investment.
The Net Interest Margin (NIM) continued to increase as the asset yields remained strong, and the bank marched on with controlled deposit cost. The domestic deposit growth was in the double digits at 11 percent year-on-year, averaging at Rs1.2 trillion. The liability strategy revolved around adding low cost deposits, as UBL added 231,000 new current accounts, taking the current deposit average to Rs507 billion for 1HCY20, an increase of 7 percent year-on-year.
The average CASA ratio stood at 85.5 percent for 1HCY20, slightly lower from 86.9 percent in the same period last year. The saving accounts grew by 12 percent on average, recorded at over Rs520 billion. The cost of deposit at 5.5 percent was higher by 40 basis points year-on-year, as high interest rate was in play for the first part of the quarter. The second quarter saw the cost of deposits go down sharply to 4.7 percent, from 6.4 percent in 1QCY20, as the central bank aggressively cut the interest rates from record high to multiyear low in a matter of months.
The non-markup income went down year-on-year as multiple factors contributed. One major reason was last year’s non-core income had a substantial chunk of one-off exchange transnational reserve realization, which was not the case in 1HCY20. The slowdown in economic activity naturally led to a substantial decline in fee related businesses, which is more than half of non-markup income. The fee and commission earnings went down by 58 percent year-on-year, as the pandemic took its toll on both domestic and international fee related revenue streams.
The provisioning expense doubled year-on-year. The domestic NPLs increased slightly to Rs28 billion, taking the asset quality ratio to 5.6 percent, provided at 85.5 percent, versus a higher provision of 92 percent in the same period last year. The NPLs on the international loan portfolio also increased, and higher provisioning was required to further improve reserves. The bank put a tight lid on administrative expenses, leading to an improved cost to income ratio to 40 percent, from 46 percent in the same period last year.


Comments
Comments are closed for this article.