

HBL paid more in taxes in 1HCY20 than it made in pretax profits in the same period last year. The pre-tax profits grew by over 2.5 times year-on-year, whereas the after-tax profits nearly quadrupled yearly-on-year. These are extraordinary times, and these are extraordinary numbers. HBL has surely strengthened its position as the undisputed market leader. HBL held back on the dividends for the quarter, but that should not be a big concern for shareholders, as the bank has grown from strength to strength, even in testing times as these.
The topline grew admirably as the balance sheet expansion continued with an average growth of Rs294 billion, primarily driven by the double-digit deposit growth at 11 percent. HBL’s market share in the deposit market strengthened to 14.1 percent, as the liability growth stemmed primarily from the low-cost current accounts, accounting for more than 40 percent of the growth. HBL’s CASA ratio stands at a strong 86 percent, with the current account share at 36 percent in the deposit mix.
Volumetric increase in average earning assets coupled with 79 basis points rise in net interest margin – led to a considerable growth in net markup income. Higher CASA reduced the cost of deposits, resulting in improved margins. The non-core income lent the biggest hand to the bottomline growth, as the non-funded income more than doubled, despite modest reduction in fee related income as the economic activities remained slow.
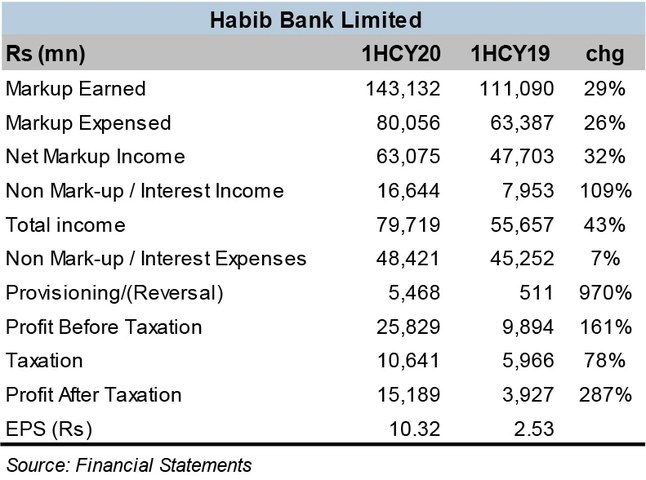
The interest rate dynamics changed swiftly during 1HCY20, more so in the second quarter. HBL cashed in on the opportunity and realized gains on government securities, well distributed over PIBs and treasury bills, both yielding over Rs3 billion in gain on sale each. A sizeable reduction in loss on sale of shares also helped the non-core income look fatter over last year, despite sale of shares still reporting losses.
The advances have stayed flattish throughout the period, as the asset growth has mainly come on the back of investments. These are fluid times, but with Pakistan’s situation improving on the Covid front, one can expect economic activity to return to some semblance of normalcy.
With interest rates expected to have bottomed out, credit demand should pick up from a variety of sectors. The banks too, will feel compelled to lend more instead of parking liquidity in low yielding government papers in the low rate scenario. The next quarter or two seem critical in determining the state of affairs, as regards the economy in general and banking sector’s reaction in particular. HBL, being the leader, should be at the core of steering how the banking industry reacts.


Comments
Comments are closed for this article.