
Can 90 Million Pakistanis get infected by COVID-19 in 40 Days? A SIR Model for Viral Growth of Coronavirus in Pakistan


A SIR Model is an epidemiological model that can be used to compute the theoretical number of people who can be infected by a contagious illness in a closed population over time. The nomenclature is derived from three components of the model, ‘S’ for susceptible people, ‘I’ for infected people, and ‘R’ for people who have recovered. The model has been used time and again to determine outbreak of infectious diseases.
Some slightly technical math follows. The model consists of three nonlinear ordinary differential equations, where ‘t’ is the time, β is the infection rate, and γ is the recovery rate. β is essentially the parameter controlling for how often contact with a susceptible person results in a new infection. γ is the parameter which determines the rates at which an infected person recovers, and moves into the resistant phase. ‘N’ here is the total population, which is the sum of those who are susceptible, those who are infected, and those who are resistant, or have recovered. The model does not assume any reinfections.

The parameters above can further be used to gain key insights, into the average number of days to recover from an infectious disease ‘D’, and the Basic Reproduction Number, which is ‘R0’. ‘D’ is ‘1/γ’, where average number of days to recover is the inverse of recovery rate. Meanwhile, R0 is simply the ratio of β and γ – and if it is greater than 1, it means that an outbreak of infectious disease exists.
Modeling Spread of COVID-19 in Pakistan
For the sake of modeling, it is assumed that the population of Pakistan is 210 million. As of writing this, number of confirmed cases is 510, and the number of recoveries is 5. It is essential to note that number of confirmed cases is solely determined on the tests that are being conducted, and hence is capped at the number of testing kits available.
Estimation of γ (rate of recovery) is essentially the inverse of the length of infectiousness. In the case of COVID-10, the incubation period is estimated to be 5 days[1].
In another study, scientists could not grow the virus from throat swabs, or sputum specimens even after 8 days of illness from people whose infection was mild[2]. Considering available information, we can assume rate of recovery to be γ = 1/8, or 0.125.
Estimates of β vary widely, and are difficult to estimate, as data continues to evolve. The same is calculated through least-square regression methodology, and has been estimated to be 0.535 in the case of USA. In the case of Italy, the same is currently 6.47 – which essentially means that a single infected person can infect another 6.47 persons. For the sake of modeling, a β of USA is assumed.
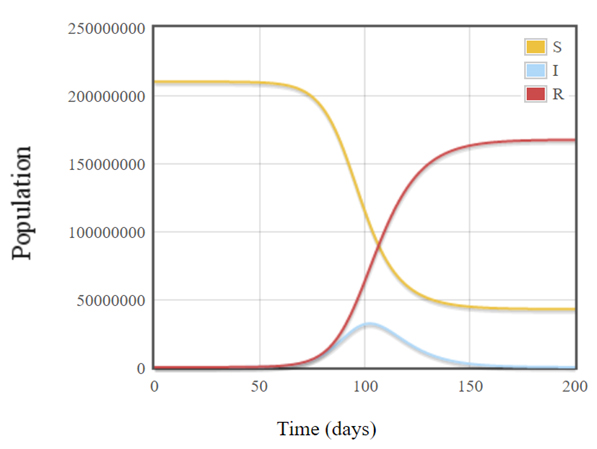
Solving the equations detailed above, the following results. If we continue as is, without any policy change, than even one infected person with an infection rate of 0.535, can multiple and potentially result in almost 90 million of the population contracting the virus by the fortieth day, or T+40 from today. It is to be noted that from global numbers, almost 95% of cases are mild. In most cases people infected have a strong immune system, and they fight off the virus, and develop resistance to it. However, it is the remaining 5%, which is about 4.5 million of total population which would be serious cases, and significantly stretch the healthcare infrastructure capacity. The graph below clearly demonstrates that overall susceptibility number drops as the number of infections, and eventually resistance increases, resulting in an S-shape recovery curve.
In the above simulation, Pakistan can have 4.5 million serious cases, a result which is not desirable, and can result in total chaos, resulting in collapse of the healthcare infrastructure. This is where policy interventions come in. It is the β that needs to be brought down. Pushing down Beta to 0.25 through interventions such as social distancing, effective ring-fending, and quarantine – the flattening of the curve can be attained, with the curve peaking at 100 days, infecting 30 million people, with number of serious cases to 1.5 million – a significant drop from earlier numbers.
The graph above clearly demonstrates the benefits of social distancing, and non-healthcare policy interventions which may seem harsh essentially, but avoid a complete collapse of healthcare infrastructure.
The odds are stacked against us. It is a ticking time bomb. A one in hundred years event. The quicker policy interventions to push down infection rate are taken, the better it will be for the country, and its population. It is now time to panic, to reduce that infection rate, and flatten that curve.

The writer is the Chief Executive Officer at the National Credit Guarantee Company Limited. The views expressed in this article are not necessarily those of the newspaper


Comments
Comments are closed for this article.