
Shakarganj Limited (PSX: SML) is the flagship company of the Shakarganj group, and one of the oldest sugar mills in the country. Established in 1967, the company is mainly concentrated in sucrose manufacturing, and has also diversified into biofuel power, building materials, textile, and farming. Shakarganj Limited holds a controlling interest in Shakarganj Food Products Limited, which is a leading producer of dairy and fruit juices.
Pattern of shareholding
The pattern of shareholding reveals that the majority of SML shares are with various Crescent Group companies - the most being with Crescent Steel. Around one-third of the shares are with the public, while the company's own executives and owners cumulatively own around 11 percent.
Past performance
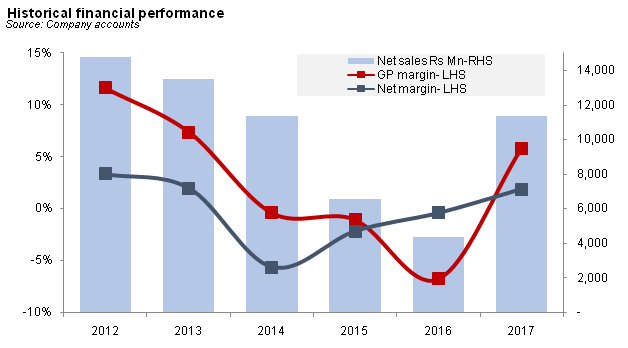
Shakarganj Limited has been in troubled waters during the past half-decade, with sluggish top-line performance due to lower than industry average production and sugar recovery. Moreover, during the period between MY12-MY16, the company's five-year sales CAGR stood at a negative 20 percent. Meanwhile, the bottom-line remained in red between MY14-MY16.
As the graph illustrates, Shakarganj sugar production had reduced dramatically over the years. As per the Director's Reports of the said financial periods, the reasons for the lower production included rise in sugarcane prices, floods in Jhang (2013), non-availability of sugarcane, shortened crushing seasons during MY16, and overall high cost of production vis-à-vis a low selling price of sugar.
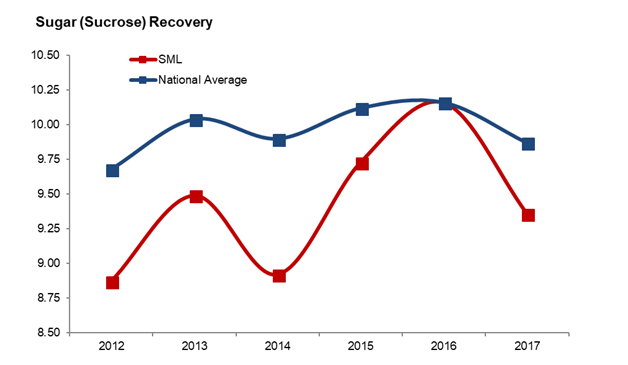
As stated above, Shakarganj sucrose recovery rate has remained lower than the national average, which is a poor position to be in for a company with one of industry's largest plant capacity. Raw sugar makes up over 72 percent of Shakarganj sales, followed by textile (16%) and bio-fuel (12%).
Recent performance
A welcome break from the past several years has come in MY17; for the marketing year ended September 2017, Shakarganj's top-line nearly tripled over the previous year. Gross profit and margins were in positive territory, with GP margin increasing by whopping 13 percentage points, as the core sugar business posted a turned around. The bottom-line received further support through profits from associates, which however declined by 33 percent over the previous year.
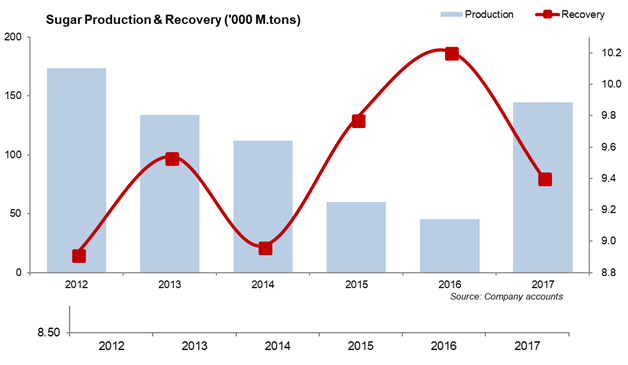
During the period under review, the company benefited from an abundant sugar crop, and started its crushing season as early as November 2016. The sugar division crushed 1.5 million tons, more than three times that of previous marketing year, and produced 144,460 tons of sugar, compared to just 45,707 tons the previous year. This led to significant improvement in profitability, with net profitability finally in the green with profits of more than Rs 210 million.
The textile division saw 20 percent higher yarn production. However, this segment was still unable to turn a profit. The company's financial report cites irregular supply of electricity and long shutdowns as hampering the division's productivity.
In the biofuel division, the production increased to 41.62 million liters (MY16: 10.20 million liters). During the year under review, the performance of this division was much better, and trended upwards in terms of production and profitability. Biofuel export is a world of opportunity and at Shakarganj almost 96 percent of biofuel produced is exported, making a positive contribution towards its net earnings.
At present, international biofuel market is improving after recent overall decline of petroleum products and there is stiff competition due to excessive supply at lower prices by leading biofuel producing countries.
In the aftermath of reduction by FESCO in the purchase rate of electricity from company's biopower division, operations at this division were suspended in 2016 and there was no bio power generation in the year under review.
Bagasse is a natural byproduct of sugar manufacturing. This consists of residual pulp and fibrous material of sugarcane after extraction of juice. This material is primarily used as a fuel source in the factory boilers for steam and power generation used in the manufacturing process. Shakarganj's fuel conservation measures coupled with economies of scale result in production of surplus bagasse. The company processes the surplus with binding agents and high-pressure compression to produce sheets of Particle Board. These sheets are commonly used as an alternative to wood in the furniture and building industry.
Outlook
Going forward, Shakarganj's bio-fuel plants are continuing production and the company is expected to reclaim its place as the leading bio-fuel exporter of the. As per director's review, management is working to acquire molasses at reasonable costs for this segment. Moreover, the company has also entered into agreement for sale of carbon dioxide (CO2) - a by-product of bio-fuel manufacturing - which is expected to reflect in future financial periods.
Once again, the country is looking at a surplus of sugar and the federal government has recently allowed export of sugar up to 225,000MT without any export subsidy, which was valid until 31st March, 2018.
Since global sugar prices have plummeted, the export subsidy is keeping the local players competitive, especially given the glut in domestic market.
==========================================================
Pattern of Shareholding (as on July 30, 2017)
==========================================================
Categories of Shareholders                               %
==========================================================
Directors and their spouse (s) and minor children    5.66%
Executives                                           5.64%
Associated Companies                                48.64%
Crescent Cotton Mills Limited                        1.52%
Crescent Steel & Allied Products Limited            21.93%
CS Capital (Pvt.) Limited                            6.08%
Roomi Fabrics Limited                                9.97%
The Crescent Textile Mills Limited                   7.22%
Trustee-SML Employee Funds (various)                 1.92%
NIT & ICP                                            6.06%
Banks, development finance institutions,
 non-banking finance companies, insurance
 companies, takaful, modarabas and pension funds      0.7%
Public sector companies                              17.5%
General Public                                      15.75%
Total                                                 100%
==========================================================
Source: Company accounts
==============================================================
Shakarganj Limited
==============================================================
Rs (mn)                              MY17       MY16       YoY
==============================================================
Sales                           11,360.16   4,373.22      160%
Cost of Sales                   10,704.34   4,668.94      129%
Gross Profit                       655.81    (295.72)
Administrative expenses            282.32     222.98       27%
Distribution & Selling Costs       161.08      55.97      188%
Other operating expenses            30.50      26.55       15%
Other income                       142.58     460.52      -69%
Profit from operations             324.50    (140.70)
Finance cost                       169.83     182.75       -7%
Share of profits from associates   195.34     291.80      -33%
Profit before tax                  350.01     (31.66)
Taxation                           139.19     (13.77)
Net profit for the period          210.82     (17.89)
GP margin                             5.8%      -6.8%    +13pp
Operating margin                      2.9%      -3.2%     +6pp
NP margin                             1.9%      -0.4%     +2pp
==============================================================
Source: Company accounts


Comments
Comments are closed for this article.