

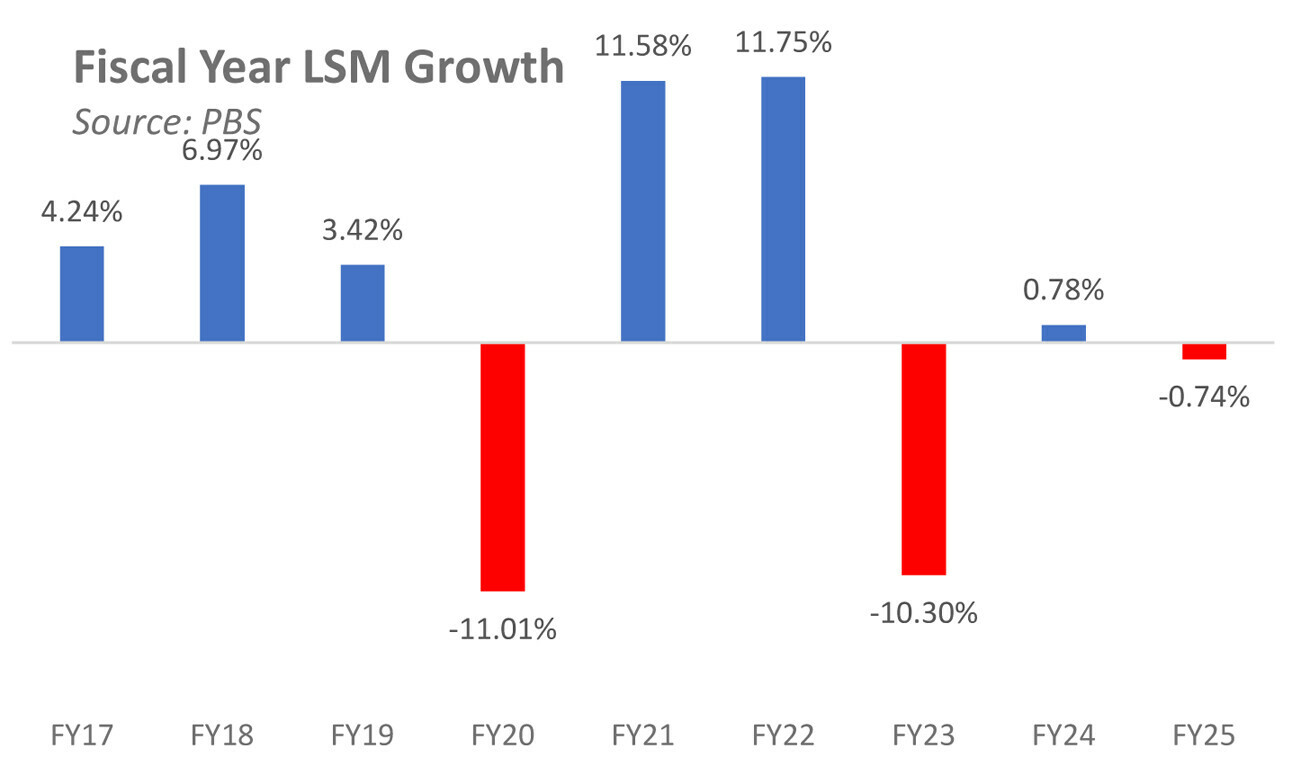
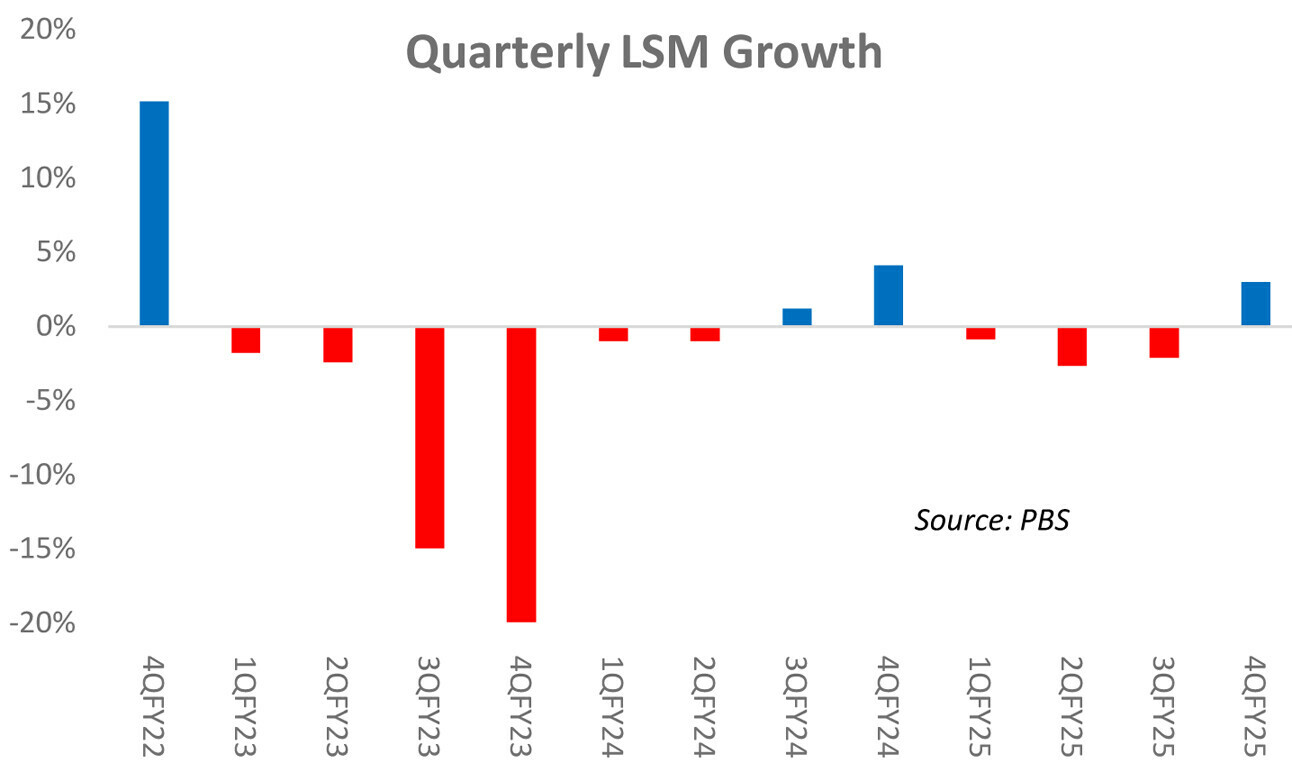
Pakistan’s Large-Scale Manufacturing (LSM) finally returned a positive quarterly growth in 4QFY25 — the first in four quarters, and only the third such instance in the last twelve. Even so, a 3 percent year-on-year uptick wasn’t enough to save the year.
FY25 closed with negative 0.74 percent growth. For context, FY24 had eked out a meagre 0.78 percent, which itself followed the FY23 bloodbath of negative 10.3 percent. In other words, the LSM has been stuck in a holding pattern for three years straight — oscillating between contraction and stagnation.
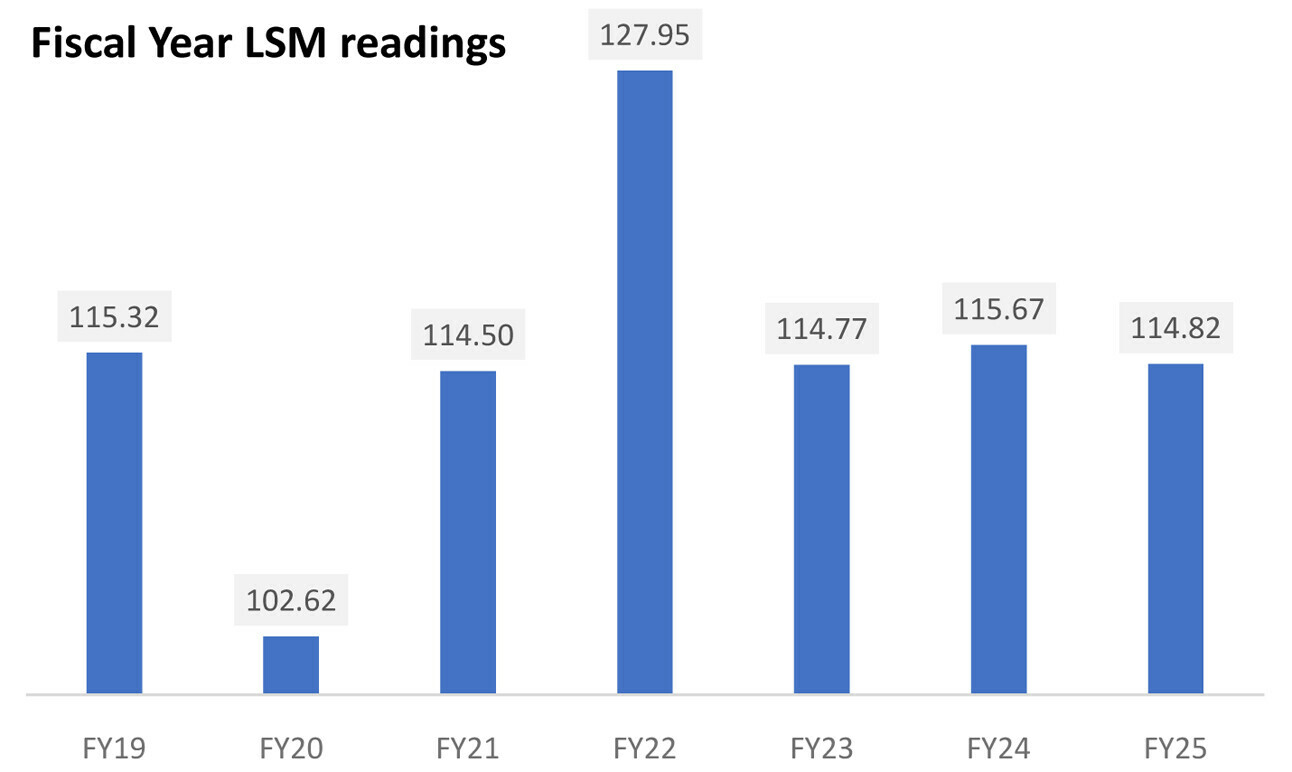
Three consecutive months of growth might tempt some into thinking the worst is over. But that’s where the glass-half-full story collapses. The FY25 LSM index still sits lower than FY19’s — and FY19 was hardly a glory year for industry. The more damning reality: 11 of the 22 LSM sectors continue to report an index value under 100.
Translation — in half the sectoral universe, output in 2025 is lower than it was when the current base was set in July 2016. And the rot doesn’t stop there.
The other five sectors had higher output in FY17 than they managed in FY25. That means two-thirds of Pakistan’s industrial basket is effectively stuck seven, eight, even nine years in the past. Any single-digit year-on-year “growth” looks less like recovery and more like cosmetic surgery on a deep wound. Sit with that for a moment.
Take textiles, the heavyweight sector. Its index has now stayed under 100 for the third straight year — lower even than during peak Covid disruption. Automobiles, which delivered the second-highest positive contribution to LSM in FY25, still crawls at an index value of 78 — hardly a comeback.
Meanwhile, entire categories — tobacco, leather, wood, chemicals, rubber, metals, TVs, machinery, motorcycles — are producing less today than in FY16. Others like iron and steel, pharma, petroleum, and beverages were all stronger in FY17 than now. That’s not cyclical weakness; that’s regression.
On the “positive” side, the numbers flatter to deceive. Only two sectors out of the 12 that grew — automobiles and other transport equipment — managed double-digit growth.
The rest are confined to anemic low-to-mid single digits. On the flip side, five of the ten shrinking sectors saw output fall by double digits. That’s the real story: declines are deeper and broader, while gains are shallow and narrow. The few bright spots — like readymade garments and fertilizer — only underline how lonely the positives are.
Even those positives are losing steam. Ready-made garments, for instance, started FY25 with roaring double-digit growth but limped to just 5.7 percent by year’s end. With Trump-era tariffs set to reshape global trade, this crucial sector may struggle to maintain even that momentum. Garments have carried LSM on their shoulders for the past two years, but shoulders can only carry so much.
Zoom in closer, and the picture turns even grimmer. Of the 123 individual items tracked for LSM, 64 now produce less than they did at the start of the base year in 2016. That statistic alone is a staggering indictment of how far Pakistan’s industrial base has hollowed out. It lends weight to the growing argument that the country has already entered the phase of premature de-industrialization.
Yes, there are whispers of a turnaround: cheaper credit, lower energy tariffs, and a smattering of policy tweaks. But without deep structural reform — in energy pricing, business climate, and export competitiveness — the revival will be painfully slow, if it comes at all. For now, Pakistan’s industrial engine isn’t accelerating. It’s stuck in reverse, idling in the past most countries worked to leave behind.


Comments
Comments are closed for this article.