BR100 Increased By (2.8%)
BR30 Increased By (3.57%)
KSE100 Increased By (2.38%)
KSE30 Increased By (2.44%)
AGHA 6.12 Increased By ▲ 0.09 (1.49%)
BECO 4.16 Increased By ▲ 0.30 (7.77%)
BML 62.73 Increased By ▲ 1.73 (2.84%)
BOP 30.90 Increased By ▲ 2.81 (10%)
CNERGY 11.97 Increased By ▲ 0.23 (1.96%)
CSIL 5.42 Increased By ▲ 0.12 (2.26%)
FCCL 56.78 Increased By ▲ 2.32 (4.26%)
FFL 13.34 Increased By ▲ 0.27 (2.07%)
FNEL 1.15 Increased By ▲ 0.04 (3.6%)
KEL 6.00 Increased By ▲ 0.37 (6.57%)
KOSM 5.48 Increased By ▲ 0.14 (2.62%)
LOTCHEM 24.37 Increased By ▲ 0.54 (2.27%)
MLCF 97.49 Increased By ▲ 4.51 (4.85%)
NBP 174.50 Increased By ▲ 11.30 (6.92%)
NCPL 48.47 Increased By ▲ 0.20 (0.41%)
NPL 50.23 Increased By ▲ 0.52 (1.05%)
OGDC 310.47 Increased By ▲ 6.84 (2.25%)
PACE 9.05 Increased By ▲ 0.08 (0.89%)
PAEL 33.07 Increased By ▲ 1.16 (3.64%)
PIBTL 13.15 Increased By ▲ 0.41 (3.22%)
PPL 217.17 Increased By ▲ 4.26 (2%)
PRL 85.66 Increased By ▲ 1.32 (1.57%)
PTC 46.19 Increased By ▲ 1.20 (2.67%)
SSGC 23.32 Increased By ▲ 0.49 (2.15%)
TBL 9.02 Increased By ▲ 0.14 (1.58%)
TELE 6.73 Increased By ▲ 0.23 (3.54%)
TPL 26.10 Increased By ▲ 1.84 (7.58%)
TPLP 12.67 Increased By ▲ 0.68 (5.67%)
TREET 23.80 Increased By ▲ 0.66 (2.85%)
TRG 53.17 Increased By ▲ 1.70 (3.3%)
Markets

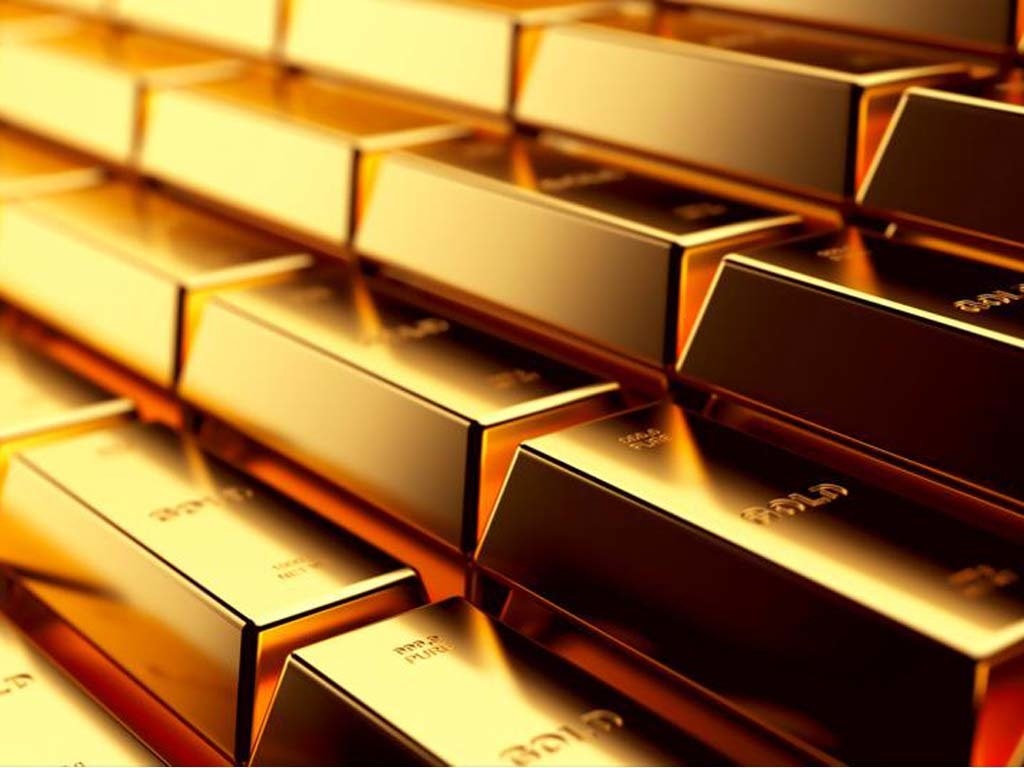
Spot gold may test resistance at $1,884

  • Gold has cleared a lower resistance at $1,867. It is heading towards the $1,884-$1,902 range.
Published Updated
By

SINGAPORE: Spot gold may test a resistance at $1,884 per ounce, a break above which could lead to a gain to $1,902.

The resistance is identified as the 50% retracement of the downtrend from $1,959.01 to $1,809.90. Gold has cleared a lower resistance at $1,867. It is heading towards the $1,884-$1,902 range.

A break below $1,867, now a support, may cause a fall to $1,845. On the daily chart, a projection analysis reveals a resistance at $1,886, the 23.6% level of a wave C from $1,959, which is close to $1,884 (hourly chart).

This resistance may be broken, as the metal may approach $1,914, around which, the big black candlestick started on Jan. 8.

Charts are not available in reports received in email box through "Alert". To get charts, use the news code to retrieve the original reports.

Comments

Comments are closed for this article.