




The CPI is crawling up at a snails pace. It increased by 4.2 percent in February 2017 to take the eight-month average to 3.9 percent. Last year, full year inflation was at 2.8 percent and this year the number would be around 4 percent. Trends, and external and fiscal imbalances are warranting inflation to pick up further in 2018. Yet the number are comfortable to keep policy rate at 5.75 percent.
The food inflation in February increased by 0.3 percent on monthly basis, and by 3.1 percent on yearly basis. Prices of some food items, which were declining in the past few months are on the rise, while some others are down; hence the neutralised impact. 12-month moving average for the food sub index is at 3.5 percent; it was 1.6 percent exactly a year ago.
The second biggest sub-index Housing and utility increased by 4.8 percent. And the most expensive sector lately is health, which increased by 14.1 percent. The second most expensive, education increased by 11.3 percent. The combined spend on these two is around six percent by an average household. This tells that either the index needs serious rebasing, or the consumers have to readjust spending patterns to enhance productivity. Anyways, basics are getting costlier.

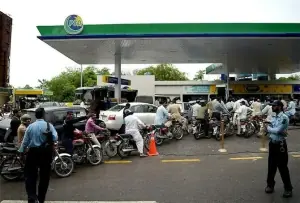
Energy prices are moving up once again as motor fuel prices increased by 3.1 percent in February. Mind you, these prices are now consistently moving up, and it's a matter of time before it cascades.
The core inflation has been hovering between 5.2 to 5.4 percent since October 16; and its 12-month moving average is at 4.9 percent, while it was 4.4 percent a year ago. The number is not likely to go up too fast in coming months; but in medium term trends may be a bit inflationary.
The monetary assets growth is approaching 15 percent, while the mix is skewed towards net domestic assets. The worsening NFA to NDA ratio has high correlation with CPI - worse the ratio, higher is the inflation.
That is the story on the demand-pull inflation. On supply side, swelling twin deficit - fiscal and current, is mounting pressure to push inflation. The question is how long would Dar not let the currency to depreciate; till that time inflation will remain well in single digit.


















Comments
Comments are closed for this article.