


Forensic Investigation for the SECP into the KSE events of March 2005: Diligence Report of Findings
Executive Summary: In March 2005, the KSE 100 Index experienced a sudden and significant decline. After a substantial rise in early 2005 to a record high of 10,303 on March 15, 2005 (an intensified run which lured large numbers of investors into the market and pushed trading to unprecedented volumes), the KSE 100 then fell precipitously, losing approximately 25% of its value in only eight trading sessions.2
Given the considerable investment losses experienced by individual market participants, strong public reaction ensued in Karachi and elsewhere. Lacking definitive answers, rumours and theories abounded as to the underlying cause of the sudden rise and fall of the market in March 2005. Speculation arose in attempts to explain the possible contributing factors.
Expressed possibilities included overambitious day traders and an overheated futures counter, as well as the manipulation of the financing and equity markets by various major market players. This last hypothesis has received the most attention, and it is the main subject of this Report.
The March 2005 market fall was a significant socio-economic event in Pakistan: billions of rupees in capital market value were created and reversed in a matter of weeks, and there were widespread accusations of unscrupulous and manipulative behaviour.
Seeking answers, politicians and the media in Pakistan called for serious governmental inquiries to determine both the root causes of the market's decline and whether manipulation or other wrong-doing had, in fact, contributed to the wide-spread financial losses.
In response, the SECP appointed a Taskforce in April 2005 with terms of reference to investigate, among other things: the causes of the significant market decline; the role of various market participants; and certain market manipulation allegations.3
In its June 2005 report (the "Taskforce Report"), the Taskforce concluded that the rise and fall of the stock market in March 2005 was at least partly attributable to a number of manipulative activities, schemes and market abuses involving unnamed brokers.
The Taskforce Report further suggested that there was an orchestrated scheme to influence scrip prices involving several (unnamed) brokers, which directly or indirectly conspired to artificially inflate the market, lock in prices by selling short in Futures, then constrict liquidity-causing prices to plunge and reaping billions in illicit gains in the process.4.
-- (2 The KSE 100 index rose from 6,220 on January 3, 2005, to 10,303 on Mar. 15, 2005, and fell to 7,708 on Mar. 28, 2005. "Market Overview," Pakistan Press International Information Services January 4, 2005, "Stock Market Report," Pakistan Press International Information Services Mar. 16 and Mar. 29, 2005.)
-- (3 Dr Tariq Hassan "Statement Before the Public Accounts Committee on The Recent Crisis in the Stock Exchanges & Measures Taken by the Authorities" (Islamabad, Pakistan, Apr. 2, 2005). See SECP website www.secp.gov.pk. "SECP Constitutes Task Force To Investigate Stock Market Crises" SECP Press Release, Apr. 2, 2005.)
TO SUMMARIZE THE ALLEGED SCHEME'S KEY COMPONENTS:
1. First, certain brokers conspired to use manipulative trading practices to drive scrip prices up. Through wash trades and misleading statements, they created artificial euphoria and overly optimistic sentiments -drawing additional investors into the market and driving scrip prices even higher.
2. These brokers liberally supplied increasing volumes of COT for the heightened demand in trading, which further escalated prices and permitted smaller investors to take on highly leveraged positions. These brokers later systematically restricted COT availability, sending share-hungry weak investors to the Futures counter.
3. As scrip prices rose, the brokers locked in those (inflated) prices by selling heavily in the March Futures contracts and further complicated the scenario by selling shares they did not actually own, fully intending to defer the acquisition of those shares to a later date to benefit from anticipated price declines.
4. At a later stage, these same brokers then adversely influenced the market's liquidity through additional COT restrictions which had the effect of stalling the market and sending scrip prices downward. Brokers then purchased the requisite shares in the Ready Market, at highly discounted prices, to satisfy delivery of setoff shares in settlement of their March Futures sales contracts and reaping hefty profits in the process.
5. Finally, in order to prevent massive defaults by buyers stuck with open Futures contracts, these same brokers persuaded regulators to create special trading periods and to extend the normal settlement period by three days to allow the brokers to provide additional COT funding to Futures contract holders.
The Taskforce acknowledged that the enormity of the task of analysing the various factors associated with the market's fall in March 2005 necessitated a much longer and more thorough investigation. Its effort was complicated both by the massive volume of data to examine, and by the inherent limitations of this data.
Accordingly, the Taskforce called on the SECP to conduct a follow-on forensic investigation of the most material alleged abuses.5
-- (4 "The Taskforce has identified the factors and actions which contributed to the instability in the stock prices, both as the market went up and as it collapsed.
-- Relying on macro-level information, the report has described the manner in which some participants appear to have benefited from the manipulation of market sentiment, prices and liquidity; identifies the key causes of the situation that developed in March 2005; and explains how the transactions arranged outside the rules of the market ostensibly to 'save' the market benefited some of the very people who arranged these transactions."
Stock Market Taskforce, Report of the Taskforce: Review of the Stock Market Situation, (Islamabad, Pakistan, 2005) para 7. The Taskforce report went on to conclude that "a pattern emerges in which different scrips were manipulated and played in different ways by the major brokers to their advantage." para 54. The market's regulators and KSE's board and management also shared in the blame. paras: 32, 43-48. See also paras: 13, 16-18, 23, 24, 26, 28-35, 39, 54 and 55.)
RETENTION OF INDEPENDENT FORENSIC INVESTIGATORS AND SCOPE OF WORK:
Diligence was retained by the SECP in July 2006 to examine in more detail the activities surrounding the March 2005 events, and specifically, to determine if manipulative schemes and/or illicit conduct were prevalent and played a key role in the market's precipitous decline.
Over the past few months, Diligence has conducted an independent examination6 into the most noteworthy allegations: 1) restriction and withdrawal of COT (including, to the extent possible, in-house Badla7), 2) wash trades, and 3) violation of the regulations governing futures contracts. Particular emphasis was placed on the regulated COT issue because of its perceived importance and the relative availability of reliable data.
In the process of its work, Diligence acquired and examined a multitude of electronic data records ranging from KSE Ready, Futures and COT transactions, back-office broker trading records and general ledger information, as well as detailed Central Depository Corporation of Pakistan ("CDC") share balance data.
This information, comprising tens of millions of electronic records, was compiled, reconciled where possible and loaded to a comprehensive database for analysis. In addition to this expansive repository of electronic information, Diligence acquired and reviewed an extensive number of hardcopy documents including analyst reports, news articles and KSE activity reports.8
-- (5 Ibid. paras: 24 (regarding wash trades), 33 (regarding the manipulation of COT), and 55 (regarding the sale of scrips in Futures market not yet owned by the seller).
-- (6 The SECP provided general assistance and support to Diligence in our investigation of the matters covered in this Report. Diligence otherwise acted independently throughout the investigation in fulfilling its mandate under the terms of the LOE, including data sought and obtained, methodologies applied and the resulting findings.)
-- (7 Comprehensive and accurate data on the quantities and activities of in-house Badla are not reported publicly by individual brokers or maintained in any form within the public domain. Diligence found abundant indirect evidence (eg press reports) of the existence of this form of unregulated Badla which, to the extent it exists, is in violation of Section 16 of the Securities and Exchange Ordinance, 1969.)
-- (8 In the course of its investigation, Diligence requested information (through the SECP in some cases) from a number of parties, including the SECP itself, KSE, CDC and certain brokers. All such parties co-operated and provided certain data responsive to Diligence's requests. There was insufficient time, in some cases, however, to independently verify or cross check such data. There were also issues, in certain cases, with delays in obtaining the data and, as noted above, with the quality of the data - factors that periodically and adversely impacted the progress of our work.)
Throughout this effort, Diligence gained a true appreciation for the enormity and difficulty of the Taskforce's mandate. Generally, the collection and analysis of historical information of this nature and magnitude is a difficult task. The data collection and analysis was further complicated in this case, however, by the inconsistent and often incomplete nature of the trading-related records and information provided to Diligence.
In particular, the absence of universal client identification codes across all brokers, the inconsistent use of client codes within individual brokers, the presence and widespread use of CDC group accounts, and the KSE's failure to preserve the order book records and critical compliance documents all presented significant obstacles to addressing the various issues herein. Diligence was not able to analyse, in many respects, the type of trading-related data that is normally generated and safeguarded by securities market participants elsewhere.
Accordingly, we support the view that the Taskforce should have been provided with additional time, resources and expertise to more thoroughly examine these complicated matters prior to rendering its report.
Diligence further takes note of the fact that the SECP has committed itself in this past year to improving the quality of the reporting process and has implemented or is moving forward on important regulations aimed at increasing transparency and accountability in Pakistan's capital markets, many of which address the identified shortcomings and limitations we encountered in the data.9
SUMMARY OF FINDINGS:
Under the existing circumstances, and on the basis of the evidence examined to date, we render findings and conclusions that greatly differ, in many respects, with the findings and conclusions rendered by the Taskforce. Most significantly, we do not find sufficient evidence to support the paramount scheme of manipulation in the manner put forth by the Taskforce for the period in question.
Nor do we find sufficient evidence to support the alleged scheme's primary element (withdrawal of COT) that was ostensibly responsible for the fall of market prices. We find no patterns of activity or credible evidence to support a theory that, during March 2005, certain influential brokers systematically and manipulatively inflated and then deflated market prices, reaping substantial profits in the process.
-- (9 For example, the SECP has now required the implementation of Unique Identification Numbers for all investors. This requirement will enable the three exchanges and the SECP to easily identify the underlying client behind any stock market transaction, across all brokers. SECP Letter to KSE, LSE and ISA, August 3, 2006. Also, the SECP has suggested that CDC eliminate the use of group accounts for reporting client holdings at CDC. Individual sub-accounts at CDC will more readily allow for the identification of beneficial share ownership and the assessment of potential short sale violations. Letter from SECP to Central Depository Company of Pakistan Limited. "Prohibition on Use of Group Account By CDS Participants." No 1(6)cdc/pol/1997, 6 January 2005.)
It is important to note however that, as a result of our analyses, we did find prima-facie evidence of possible wrongdoing by a significant number of brokers in certain areas. We are of the view, however, that these potential wrongful acts individually or collectively were not elements of an elaborate scheme to manipulate the volatility of the market, as alleged by the Taskforce. In all such cases, Diligence has provided its underlying data and analyses to the SECP for its action as per law.
PART I - COT WITHDRAWAL:
In Part I of this Report, we present our examination of COT and in-house Badla activities. Contrary to the Taskforce's findings, we found no evidence that regulated COT was restricted or withdrawn from the market in the weeks prior to the market's fall as a result of voluntary and manipulative actions of any influential broker.
Instead we find that although there was, in fact, a withdrawal of certain regulated COT during February and March of 2005, this activity was attributable to two independent factors: (1) the execution of the SECP's previously planned and announced phase out of COT funding for certain scrips, which had begun in October 2004; and (2) the temporary suspension of "New COT" availability for two heavily-traded scrips, Pakistan State Oil (PSO) and Pakistan Telecommunications Company Limited (PTC), in connection with their respective moves to Spot trading to execute announced dividend payments - a necessary trading practice and "normal course of business" event.
Moreover, we found that the market's supply of "New COT" (the value of newly initiated carry over transactions transacted on the KSE on a given trading day) for the scrips not subject to a regulated withdrawal or self-imposed temporary suspension increased during the two weeks immediately prior to the market's fall and remained stable and available until the market's virtual shut-down beginning March 21st.
Trading information on unregulated Badla ("in-house Badla") is not readily available from exchanges or the public domain, but only from individual brokers engaging in such activities. Even then, data, if any, provided by individual brokers could not be reasonably or easily independently verified or tested for completeness or accuracy with a sufficient degree of certainty. Given these and additional time constraints, reliable and verifiable data related to potential trading levels of in-house Badla was not obtainable. Therefore, Diligence is unable to provide any conclusive findings in this area.
PART II - WASH TRADES:
In Part II, we present our examination of potential violations of certain securities regulations in connection with wash trades within the same broker and between different brokers. Given the lack of unique client identification codes at that time, an examination of potential wash trades between different brokers was not possible, contrary to statements made by the Taskforce.
Also contrary to the conclusions reached by the Taskforce, in our examination of potential wash trades within the same broker, we found no systemic patterns or evidence to suggest influential brokers had collectively orchestrated multiple series of wash trades for purposes of broad-scale market manipulation.
During the course of our examination, we did however find numerous individual and isolated incidents of potential violations of Section 17(a) of the Securities and Exchange Ordinance, 1969, generally applicable to wash trades. Details on these matters have been provided to the SECP for its action as per law.
PART III - Futures Contracts:
In Part III, we describe our findings of potential and significant manipulations by brokers related to violations of Clause 3(b) of the Regulations Governing Futures Contracts (exceeding the Rs 50 million threshold) and Section 17(a) of the Securities and Exchange Ordinance.
-- Clause 3(b), during the relevant timeframe of this review, prohibited a broker from having a net sale position in futures contracts of a particular scrip in excess of Rs 50 million without providing evidence that it held the shares sold above the threshold.
-- We identified 2,491 instances across 88 brokers with net sales positions in March 2005 futures contracts alone that exceeded the Rs 50 million threshold for a particular scrip. Collectively, these net sale positions total in the billions of rupees. Many of the cases, if substantiated as being non-compliant with Clause 3(b), could represent serious violations. We have provided this information to the SECP, which is pursuing the matter as per law.
Using share data obtained from CDC, we further identified thirteen brokers trading on the Futures counter in potential breach of Clause 3(b) and Section 17(a) of the SEO. The more serious potential violations amount to hundreds of millions of rupees in value in unaccounted for shares and, if substantiated, would represent a serious violation of the securities regulations.10 Again the matter has been provided to the SECP for its action as per law.
-- Lastly, in addressing the Taskforce's primarily central element of its scheme of market manipulation-which is the withdrawal of regulated COT by the same brokers in large net sale positions in excess of share holdings at CDC-we examined the lending of New COT on COT-eligible scrips by the more influential brokers during the weeks preceding the market's fall. We found no evidence that the brokers-individually or collectively- engaged in a withdrawal of available New COT from these scrips in the market.
-- (10 We caution the reader of the many limitations of the CDC data in making a prima facie case of non- compliance or violation of securities regulations. These limitations and caveats are described in more detail in Part III of this Report. Clearly, in substantiating any violation of securities regulations, additional evidence not collected as part of this analysis will be required.)
MISCELLANEOUS:
In addition to the alleged schemes described above, Diligence also attempted to analyse whether one or more brokers conducted illicit blank Ready Market sales. This scheme involves selling shares on the Ready Market that the investor does not own and cannot deliver at the T+3 settlement date.
Unlike Futures positions which can be accumulated and quantified for each discrete monthly contract, ready positions cannot be quantified on the basis of KSE activity alone. Reliable and detailed investor-level share balance information is required in order to determine whether a client has transacted a blank sale on the Ready Market. As discussed elsewhere in this Report, the use of group accounts at CDC precluded such an analysis for the period at issue. Without additional verifiable and complete information from individual brokers, it is not possible to determine whether or not this type of illicit activity was perpetrated on the market during March 2005.
CLOSING REMARKS:
It has been Diligence's privilege to work with the SECP on this matter. We are grateful for the assistance and many courtesies that have been extended to us by individuals and entities in Karachi and Islamabad during the course of our investigation.
We are sensitive to the fact that many investors may have lost significant sums in the KSE crash of March 2005. Such an event demands a thorough investigation into the facts and circumstances underlying the market's movements, to determine if fraud and manipulation occurred at the expense of those investors. Investors must also recognise, however, that securities markets everywhere have inherent and individually unique risks which, without warning or manipulation, may unexpectedly cause the market to rise or fall as risks, regulations, economic conditions and market sentiments quickly change.
In the time period since March 2005, the capital markets of Pakistan have been awash in speculation, conspiracy theories, allegations, mis-leading conclusions and unfounded views as to what and who may have caused the market's rapid rise and decent.
We found this situation to be unnecessarily fuelled by rumour and innuendo, and seriously absent of definitive facts and complete and proper analysis. Had the Taskforce been afforded additional time and resources to investigate the facts and events of March 2005 further, perhaps more definitive findings and conclusions would have been reached, and mis- understandings in the market, would have been diminished.
Diligence's objective in this matter was to present an independent and objective expert analysis of the key market-related events of March 2005. In so doing, we hope our work helps bring to justice those found guilty of violating securities laws, but more importantly, helps bring closure to an unfortunate and disruptive episode for Pakistan by finally putting to an end the unfounded allegations and speculation that have continued to persist concerning the market's crash and resulting Taskforce Report. We also hope that our investigation assists the SECP and others with the on-going process of adding additional critically-needed elements of transparency, accountability and integrity to Pakistan's capital markets. To that goal, we respectfully present Diligence's Report of Findings to the SECP.
Part - I: Withdrawal of Regulated COT:
I. INTRODUCTION AND SUMMARY:
In this Part, we focus on the possible role of regulated COT in the decline of the KSE during the first quarter of 2005, and respond in certain limited respects to the allegations and issues put forth by the Taskforce Report on the subject.
The analysis addresses the allegations and issues concerning only the withdrawal of COT financing before the market's decline. Other possible contributing factors to the events of March 2005 put forth by the Taskforce Report and others are addressed in other Parts of this Report.
We specifically address below, through analysis of the following three core questions, the allegations that regulated COT transacted on the KSE open market was intentionally restricted by COT lenders prior to, and thus precipitated, the market's decline:
1. Was there a substantial withdrawal of funds from the COT market in the period immediately prior to the market's steep decline?
2. If there was a withdrawal, what was its cause?
3. Is there credible evidence that indicates or suggests that any such withdrawal of funds was manipulative in nature - as part of a scheme to essentially defraud the market?
The answer to the first core question is "yes." Diligence confirmed the findings of the Taskforce which reported that there was a withdrawal of funds from the COT market in the weeks and months prior to the market's decline.
In answering the second and third core questions, it is important to note that our forensic investigation, pursuant to the SECP's request, has gone further and to additional levels of detail than the previous work of the Taskforce, the SECP itself, and others.1 Our extensive and detailed analysis in this area established that funds were withdrawn from the COT market. We further identified the reasons for the withdrawal of funds. Significantly, we have found no credible evidence, as of the date of this Report, which indicates or suggests that the withdrawal of funds from the regulated COT market was manipulative in nature. Accordingly, with respect to the regulated COT subject that is the subject of this Part, there does not appear to be a factual basis for recommending to the SECP that it should consider legal proceedings against any firm(s) or individual(s) based on a market manipulation theory.
-- (1 The SECP provided general assistance and support to Diligence in our investigation of the matters covered in this Report. Diligence otherwise acted independently throughout the investigation in fulfilling its mandate under the terms of the LOE, including data sought and obtained, methodologies applied and the resulting findings.)
-- The following analysis, glossary and accompanying appendices describe and illustrate in detail the methodologies used in our forensic examination of millions of trading records and other data which substantiate these central conclusions.2
II. FORENSIC EXAMINATION OF CARRY-OVER TRANSACTIONS ON THE KARACHI STOCK EXCHANGE:
Prior to the introduction of the Continuous Funding System in August 2005, COT was a primary financing facility used to leverage the purchase of securities in the Pakistani capital markets. COT, also referred to as "carry over trades" or regulated badla financing, had historically played an integral role in providing liquidity to Pakistan's three capital markets. Seeking a more modern financing alternative with less attendant risk to participants, the SECP moved in September 2004 to begin the permanent phase- out of COT as the market's primary leveraging mechanism.3
The significance of the COT mechanism is that its use enabled an investor in the Ready Market to defer or "carry over" settlement, and thus defer payment, of a purchase of scrips to a future date. In essence, COT was a form of repurchase agreement. In conducting a carry over transaction, the investor sold all or a portion of his/her open position in eligible scrips to a COT lender with the agreement to repurchase the shares in a subsequent trading cycle. In exchange, the lender was paid a rate of interest, which fluctuated based on market conditions and regulations.4.
In addition to this regulated market (as established in the "Carry Over Transactions Regulations, 1993"), brokers have customarily engaged in unregulated COT lending through what is commonly referred to as "In-house badla." This practice consists of financing COT directly and solely between the broker and client, and is not conducted through the stock exchanges.
Due to the lack of available and reliable data maintained by the brokers, Diligence has not been able to examine the activities related to the market's in-house Badla, and therefore this Part does not include definitive findings concerning the possible broker activities related to in-house Badla. Additionally, the regulated and unregulated COT activities on the Lahore or Islamabad exchanges were not included in the scope of the Diligence LOE.5
-- (2 A critical analytical point is that the conclusions herein were reached on the basis of available data. We note that a key set of data under the KSE's control and central to addressing the three core questions no longer exists, and was therefore not available for review and analysis: the KSE's daily order book of queued and filled orders for new open market COT for the days before and during the market's steep decline.
The KSE daily order book would provide, theoretically, an indication of whether request orders for COT were increasingly being left unfilled as the demand for COT increased, indicating a squeeze in liquidity. KSE representatives have explicitly and consistently stated to Diligence that this data is not available, except for the single day of Mar. 15, 2005 previously collected by the SECP. Nonetheless, our findings are conclusive based on other available evidence.)
-- (3 KSE Continuous Funding System Regulations, 2005; August 22, 2005. See also: "Time-Bound Action Plan for Phasing-Out of Carry-Over Transaction (COT)" SECP Directive, September 3, 2004, No SMD/SE/2(72)/2003.)
-- (4 For COT, the borrower had the option of deferring settlement up to ten days. See KSE website: www.kse.com.pk. COT Regulations did not prohibit investors from selling shares they owned in the COT market that had not been purchased that day on the Ready Market. Interview with SECP staff. For more discussion and data on this topic, see Appendix B.)
FOR PURPOSES OF THE ANALYSIS HEREIN, IT IS IMPORTANT FOR THE READER TO UNDERSTAND TWO CRITICAL TERMS USED TO DESCRIBE DIFFERENT TYPES OF COT SPECIFIC TO THIS PART:
-- New COT: represents the value (in Rupees) of new carry over transactions transacted on the KSE on a given trading day. New COT is equivalent to "Open Market COT" provided on the KSE Daily Unreleased/Open Market COT reports.
-- Total COT: represents the value (in Rupees) of outstanding carry over transactions at the end of a given trading day. Total COT is the sum of unreleased carry over transactions from the previous trading day plus New COT. Total COT is equivalent to "Total COT" provided on the KSE Daily Unreleased/Open Market COT reports.
A. IMPORTANCE AND TRENDS OF COT INVESTMENT:
-- In October 2004, as the regulated COT phase-out began, COT was available on only twenty-nine of more than 670 scrips traded on the KSE.6 Despite this limitation to fewer than five percent of listed scrips, trading in COT-eligible scrips accounted for the large majority of the trading activity in the Ready Market.7
-- In the few months prior to its regulated phase-out, the market's Total COT remained relatively stable, fluctuating between Rs 22.7 billion and Rs 28.5 billion per day.8
-- Starting in November 2004, however, Total COT began to increase significantly, reaching an all-time high of Rs 40.3 billion on February 18, 2005. As shown in Chart 1, this dramatic rise soon gave way to a precipitous drop of Rs 11.0 billion to Rs 29.0 billion by March 15, 2005 (the day before scrip prices on the KSE began their steep decline), bringing the daily levels of Total COT back to a level more consistent with its 2004 volumes 9. The rapid decline in Total COT in the days prior to the market's drop was later identified by many-including investors, regulators, the SECP Task Force and the press-as the result of likely market manipulation. The drop in Total COT was further viewed by many as a primary contributing factor to the market's eventual collapse.10
-- (5 See: "Carry Over Transaction Regulations," January 11 1993. On September 11, 2006, the SECP mandated the elimination of In-House badla in an effort to increase the transparency of the COT market. See: "In-House Badla Banned: CFS Cap Enhanced to Rs 55 Billion for KSE: Recorder Report," Business Recorder September 12, 2006. Dilawar Hussain "SECP Defers In-House Badla Ban" Dawn: The Internet Edition September 21, 2006.)
-- (6 See Appendix A for list of scrips, by symbol and name, and their respective scheduled phase-out dates. KSE Transaction Market Data, July 2004 to March 2005.)
-- (7 Between July and October 2004, for example, more than 90% of total trading activity on the KSE was represented by trading in COT-eligible scrips. KSE Transaction Market Data; Ready Market, July 2004 to October 2004.)
-- (8 The findings as described throughout this Part are generally represented in share values (in Pakistani Rupees), as opposed to number of shares. Findings will also be described in number of shares in the event such data reflects a different pattern or trend than share values.)
-- Chart 1 - Daily Values of Total COT, KSE, In Rupees Billions, For the Period July 1, 2004 to March 15, 2005
-- (9 KSE Unreleased/Open Market COT Daily Reports, July 2004 to Mar. 2005 Karachi Stock Exchange website: www.kse.com.pk Path: COT History, 2004, 2005.)
-- (10 Taskforce Report, paras: 33 - 35. See also: Dr Tariq Hassan "Statement Before the National Assembly Standing Committee on Finance and Revenue: On Actions Taken by the Securities and Exchange Commission on the Recommendations of the Report of the Task Force" (Islamabad, Pakistan August 3, 2005). See: Securities Exchange Commission of Pakistan website www.secp.gov.pk. See also: Bilal Mohammad Ali "Pullout of badla financiers blamed for KSE Crises" The News International, Mar. 31, 2005. See also: "Stock Market Crisis: PM Asks SECP to Investigate Reasons" Dawn Mar. 31, 2005. See also: Amanullah Khan, "PM Wants Smiles Back At KSE" Pakistan Observer Mar. 31, 2005. See also: "Recent KSE Downslide: PM Orders Inquiry" Daily Times Mar. 31, 2005.)
GRAPH NOTES: From February 18 to March 15, 2005, available COT declined from an all-time peak of Rs 40.3 billion to Rs 29.0 billion-a drop of 28%.
B. THE SIGNIFICANCE OF "NEW" COT AVAILABILITY:
The significance of New COT is best illustrated by comparing the differing elements of control of a COT borrower and lender, respectively. Once a COT borrower had initiated a COT transaction, he or she then had the option to roll-over his or her position on a daily basis for up to ten trading days. The borrower was thus in temporary control of when to exercise the scrip's repurchase and the related release of his or her debt.11.
Conversely, the COT lenders were in total control of the amount of New COT provided to the open COT market each trading day. This distinction is important and is the basis for our use of daily New COT transactions as the more suitable metric in examining the financiers' control of and impact on liquidity in the market.
-- (11 Karachi Stock Exchange website: www.kse.com.pk Path: COT. Historical data related to the daily aging of unreleased COT was not maintained by the KSE. However, daily levels of New COT averaged 71% of Total COT during the period July 1, 2004 to Mar. 15, 2005, suggesting that most COT was released after just one trading cycle. KSE Unreleased/Open Market COT Daily Reports, July 2004 to February 2005, Karachi Stock Exchange website: www.kse.com.pk Path: COT History 2004, 2005. See Chart B- 1 in Appendix B.)
The daily volume of New COT from July to October 2004 varied from day to day, but was fairly stable overall, ranging from between Rs 16.0 billion to Rs 24.9 billion throughout the four-month period. As shown in Chart 2, daily transaction values of New COT began increasing significantly in November 2004, as trading volumes in the Ready Market began to rise. In January 2005, for example, the average daily volume of New COT was Rs 22.7 billion. This rose to Rs 24.4 billion in February 2005, an increase of 7.5%.12
The growing daily values of New COT also brought an increase in its daily volatility. In December 2004, for example, the daily volume of New COT fluctuated between Rs 17.5 billion and Rs 27.5 billion, dropping as much as Rs 6.0 billion in one day.13 The following month, January 2005, the range of transactions widened as the volumes of New COT fluctuated between Rs 14.0 billion and Rs 30.1 billion. At this point, the accentuated peaks and valleys of New COT trading show a cyclical pattern, rising sharply during the earlier days of the month, followed by relatively rapid and steep downturns toward the end of the month.14
Despite the dramatic variability of New COT during the above periods, its intra-monthly cycles and sudden steep declines were not mirrored in the Ready Market's activities. The Ready Market's trading volumes and prices continued their rapid ascent during these periods.15
-- Chart 2 - Daily Values of New COT, KSE, In Rupees Billions, For the Period July 1, 2004 to March 15, 2005
-- (12 KSE Unreleased/Open Market COT Daily Reports, July 2004 to February 2005, Karachi Stock Exchange website: www.kse.com.pk Path: COT History, 2004, 2005.)
-- (13 The value of New COT was Rs 27.5 billion and Rs 17.5 billion on December 22, 2004 and December 28, 2004 respectively. Between December 24, 2004 and December 27, 2004 (one trading day), New COT value decreased from Rs 25.7 billion to Rs 19.7 billion, a drop of Rs 6 billion. KSE Unreleased/Open Market COT Daily Reports, July 2004 to February 2005, Karachi Stock Exchange website: www.kse.com.pk Path: COT History, 2004, 2005.)
-- (14 KSE Unreleased/Open Market COT Daily Reports, July 2004 to February 2005, Karachi Stock Exchange website: www.kse.com.pk Path: COT History, 2004, 2005.)
-- (15 Even prior to 2005, the steep daily declines in New COT did not seem to have any meaningful negative influence on trading volumes in the Ready Market. For example, New COT decreased 33% from Rs 25 billion to Rs 16.6 billion between August 27, 2004 and September 6, 2004, yet trading volumes in the Ready Market remained unaffected.
Similar decreases in New COT were evident during the weeks of October 14th, November 29th and December 27th, but again with seemingly no negative effect on the volume of Ready Market trades. See Chart B-2 in Appendix B.)
GRAPH NOTES: Daily investment in New COT was highly variable from day-to-day, and became highly cyclical month-to-month in the months preceding the March 2005 situation. Increases in New COT were followed by sharp decreases of 37%, 53% and 52%, respectively, during the months of December 2004 and January and February 2005.
C. PROPORTION OF COT ACROSS ELIGIBLE SCRIPS AND BROKERS:
-- In addition to being available in only a limited number of the market's total listed scrips, investment in COT was heavily concentrated across relatively few of the COT-eligible scrips. Of the twenty-nine scrips eligible for COT between July 2004 and October 2004, approximately 50% of daily New COT investment was concentrated within five scrips: OGDC, POL, PSO, PTC and NBP. As the phase out of COT progressed, the collective proportion of COT exposure held in these five scrips relative to the entire COT market increased steadily. In fact, by March 2005, the New COT held in these scrips represented roughly 80% of all daily New COT.16
-- An analysis of trading data reveals that most of the brokers trading on the KSE participated in the COT market. Similar to scrips, however, daily transactions of New
-- (16 KSE Market Transaction Data July 2004 to October 2004. KSE Unreleased/Open Market COT Daily Reports, July 2004 to December 2004, Karachi Stock Exchange website: www.kse.com.pk Path: COT History, 2004. SECP Directive, September 3, 2004.)
-- COT on the KSE were heavily concentrated across relatively few brokers.17 Of the 138 brokers participating in the COT market on behalf of lenders, six brokers accounted for approximately 50% of the total value of COT purchases occurring between January 3, 2005 and March 15, 2005. By order of descending New COT values, the six brokers were: Aqeel Karim Dhedhi Securities (Pvt) Ltd, Arif Habib Securities Limited, Atlas Capital Markets (Pvt) Limited, KASB Securities Limited, Orix Investment Bank Pakistan Ltd, and Akberally Cassim & Sons. Aqeel Karim Dhedhi Securities and Arif Habib Securities together represented close to 30% of the total New COT lending market during that period.18
-- Brokers representing the borrowers of COT were less concentrated. Of the 142 brokers participating in COT sale transactions during this same period, 50% were accounted for by twelve brokers, with one broker-Aqeel Karim Dhedhi Securities-individually representing over 15% of the total COT sales market.19. More detailed analyses of broker and scrip-related trading trends and activities in the weeks prior to the market's decline in March 2005 are provided in later sections of this Part.
D. THE GROWTH AND DECLINE OF COT PRIOR TO MARCH 16, 2005:
-- The daily reduction of Total COT in the time period immediately preceding the market's sharp decline in mid- to late-March has received considerable attention by regulators, the Taskforce and others. Many have alleged that the decline in Total COT from February 18, 2005 (its peak) to March 15, 2005 was a leading cause of the market's fall. Moreover, many have also alleged that the drop in Total COT was due to the manipulative actions of a few major COT brokers and lenders.20
-- (17 KSE Market Transaction Data, July 1, 2004 to October 31, 2004. Of the approximately 200 member brokers registered with KSE during the period July 1, 2004 to Mar. 15, 2005, 138 brokers representing COT lenders participated in COT purchase transactions. Similarly, 142 of the 200 brokers representing COT borrowers participated in COT sale transactions. KSE Market Transaction Data, January 2005 to Mar. 2005.)
-- (18 Aqeel Karim Dhedhi Securities Pvt Ltd represented 14.3%. Arif Habib Limited represented 14.0%. KSE Market Transaction Data, January 2005 to Mar. 2005. See Charts B-3 and B-4 in Appendix B for a graphical representation of broker proportions of COT purchase and sale activity.)
-- (19 KSE Market Transaction Data, January 2005 to Mar. 2005. See Charts B-3 and B-4 in Appendix B for a graphical representation of broker proportions of COT purchase and sale activity. See Tables C-1 and C-2 in Appendix C for a complete listing of the brokers participating in regulated COT sale and purchase transactions on the KSE open market for the period January 3, 2005 to Mar. 15, 2005.)
-- (20 Stock Market Taskforce, paras: 7, 28-35, 39, 54, and 55.)
-- Chart 3 - Daily Values of Total and New COT, KSE, In Rupees Billions, For the Period January 3, 2005 to March 15, 2005
Graph Notes: Investment in New and Total COT declined in the period immediately preceding the Ready Market's steep decline in late March 2005. Total COT declined from its high of Rs 40.4 billion on February 18, 2005 to Rs 28.9 billion on March 15, 2005. Investment in New COT declined from its high of Rs 33.3 billion to Rs 13.5 billion on March 15, 2005.
-- The following sections of this Part specifically address the apparent reduction in Total COT, and present findings and conclusions that run counter to the general allegations that have been offered concerning this subject. In Section IV, we analyse the effects on Total and New COT of the scrips removed from COT-eligibility by regulation prior to the market's steep decline in March 2005. In Section V, we analyse the effects on Total and New COT of the scrips temporarily suspended from COT trading prior to the decline. In Section VI, we analyse the effects on Total and New COT of the scrips which were not subject to the regulated phase-out or temporary suspension. Lastly, in Section VII, we present our summary and conclusions and conclude the Part with a brief mention of other findings, presented in Section VIII.
III. MANDATED PHASE-OUT OF COT
A. INTRODUCTION:
-- COT has long been suspected as having a strong, and not altogether positive, influence on the equity markets. From a historical perspective, market analysts, securities experts and others had consistently identified COT/badla financing as the likely root cause for previous, pre-2005 occurrences of severe market volatility in the Pakistani capital markets.21 In response, SECP leadership and ranking representatives from the three domestic exchanges moved during 2004 to establish a plan to phase out COT in favour of a more contemporary margin-based financing mechanism.22
-- The SECP's September 2004 final plan contained detailed measures to be undertaken by the exchanges in implementing the phase-out and articulated a strict schedule for the phase-out of the twenty-nine scrips then currently participating in COT. The plan provided for scrips to be phased-out on a weekly basis-at the rate of one per week-in reverse order of their Total COT on August 31, 2004. The scheduled phase-out was to begin in October 2004 and conclude in June 2005.23
-- Eighteen of the twenty-nine scrips were phased-out prior to the beginning of the market's decline in late-March 2005. For purposes of this analysis, we refer to these scrips collectively as "GROUP A."24
-- (21 Previous severe market declines in the Pakistani capital markets occurred in May 2000, September 2001, and May 2002. See Elliot Blair Smith "Pakistan's Stocks Sizzle; Reforms Lift Market 56% Since Last September 11" USA Today September 16, 2002: B.07. See also: "Pakistan Shares End Lower on Border Tension Concerns" Dow Jones International News May 21, 2002. See also: "Karachi Stock Market Crashes Amid Rising Tension with India" BBC Monitoring South Asia - Political May 21, 2002. See also: "Pakistan Crisis Looming on Unregulated Badla Deals," Pakistan Press International September 29, 2000. See also: "Pakistan Stocks below 1,500 on liquidity squeeze" Reuters News June 23, 2000.)
-- (22 Chairman's Message by Tariq Hassan, Chairman, Securities and Exchange Commission of Pakistan. See SEP website http://www.secp.gov.pk/Chairman/Message.htm. See also: "Co-ordination Meeting Between SEC and Stock Exchanges", SECP Press Release Apr. 15, 2004. See also: "Leading Commercial Banks Offer Support for Margin Financing Mechanisms" SECP Press Release, June 17, 2004. Margin financing had been introduced as a method of leveraged financing for securities transactions in order to reduce the risk that borrowers would default on payment for purchased shares. In contrast to the COT financing system, which allowed market participants to purchase shares in advance of securing financing, the margin financing system would require prospective stock purchasers to secure financing prior to purchasing shares in the Ready Market. This refined financing process was designed to prevent settlement crises from persisting due to lack of available badla financing to market players - a trend that appears to be historically repetitive, as described in the press reports.)
-- (23 SECP Directive September 3, 2004. The phase-out schedule is included for reference purposes in Appendix A.)
-- (24 See Appendix D for a list of the scrips included in GROUP A.)
B. EFFECTS OF PHASE-OUT ON MARKET LIQUIDITY:
1. THE PERIOD OCTOBER 8, 2004 TO DECEMBER 31, 2004:
Three months into the scheduled phase-out, seven of the twenty-nine COT-eligible scrips had been phased out. The effects of the phase-out of the first seven scrips on the liquidity of the COT market were negligible, as the initial scrips in the phase-out plan represented proportionately the smallest investments of COT.25
2. THE PERIOD OF JANUARY 1, 2005 TO FEBRUARY 18, 2005:
-- As mandated by the SECP, COT eligibility for seven additional scrips was phased out between January 1, 2005 and February 18, 2005. The collective impact of these seven scrips was almost Rs 5 billion, and represented about 13% of the market's Total COT at the beginning of this six-week period.26 However, the net effect of their phase-out on the market's Total COT again proved negligible, as Total COT for COT-eligible scrips, despite being fewer in number, continued its steep climb to its February 18 peak, as shown in Chart 3.
-- The net gain in COT values during this period was achieved despite the withdrawal of almost Rs 5 billion from the seven phased-out scrips, indicating that new investment in COT for the scrips not yet affected by the phase-out significantly outpaced the COT withdrawn because of the phase-out.27
-- (25 SECP Directive, September 3, 2004. The phase-out schedule is included for reference purposes in Appendix D.)
-- (26 Values and percentages quoted are based on Total COT volumes in these scrips on January 3, 2005, and are provided for reference in Appendix D.)
-- (27 KSE Unreleased/Open Market COT Daily Reports, January 2005 to Mar. 2005. Karachi Stock Exchange website: www.kse.com.pk Path: COT History, 2005.)
3. THE PERIOD OF FEBRUARY 19, 2005 TO MARCH 18, 2005:
-- The withdrawal of Total COT from the four scrips phased-out between February 19 and March 18, 2005, had a similar impact on liquidity as the withdrawals from the previously phased-out seven scrips: approximately Rs 5 billion was eliminated. However, this later withdrawal of liquidity, although similar in size, was achieved through the phase-out of a smaller number of scrips in a shorter period of time. Consistent with the original intent of the phase-out plan, the investment of COT being phased-out each week was steadily increasing.28
-- In contrast to the earlier periods, however, the cumulative effect of the scrips phased-out during the period from February 19 to March 18, 2005, ultimately had a significant negative impact on Total COT during that period. The level of New COT transactions for the remaining few COT-eligible scrips did not keep pace with-and did not offset- the COT withdrawn by the phase-outs. Total COT actually declined sharply in all scrips during the latter half of February 2005. Although COT transaction volumes began rising again during the first half of March, they did not rise fast enough to offset the amount of COT withdrawn from the COT market by the scrips being phased-out.
4. CONCLUSION:
Collectively, the Total COT of the scrips phased-out from COT eligibility from January to March 18, 2005, amounted to Rs 10 billion, or 28% of the market.29 Despite some increases in New COT in the remaining COT-active scrips, and possible increases in- house Badla, the removal of a large number of scrips from COT eligibility by March 18, 2005 clearly had a negative effect on the overall available liquidity in the market and may well have been a major contributor to the market's instability.
The critical finding is that the withdrawal of liquidity, in this instance, was the result of external regulatory forces unrelated to voluntary broker and/or COT lender action. This withdrawal was mandated by SECP and KSE regulations, developed through a collaborative effort that was highly publicised to market participants, including brokers, lenders and the investing public through coverage in consumer and financial trade media. Accordingly, the withdrawal of COT for these scrips cannot be attributed to the voluntary or manipulative actions of any broker or lender.
-- (28 Values and percentages quoted are based on Total COT volumes in these scrips on February 18, 2005, and are provided for reference in Appendix D. MCB was phased-out effective Mar. 18, 2005, which falls three days after the beginning of the stock market's decline. However, given its relatively low levels of COT investment during its final week of eligibility (primarily due to trading Spot), MCB is included within the group of scrips classified as being phased-out before the market's decline for purposes of this analysis.) (29 See Appendix D.)
-- Chart 4 - Daily Values of Total and New COT for Group A Scrips (Scrips Phased- Out), KSE, In Rupees Billions, For the Period January 3, 2005 to March 18, 2005
GRAPH NOTES: The scheduled phase-out of certain scrips in the February 18 to March 18, 2005 timeframe removed over Rs 5 billion from the COT market and had a significant negative effect on overall market liquidity.
IV. TEMPORARY SUSPENSION OF COT
A. INTRODUCTION:
In the two weeks prior to the decline of the KSE in March 2005, two scrips that were subject to relatively high volumes of COT activity each had their eligibility for New COT voluntarily and temporarily suspended for a period of five trading days. Weeks earlier, the boards of both Pakistan State Oil (PSO) and Pakistan Telecommunications Company Limited (PTC) had announced the payment of dividends, given the strong financial performance of the respective companies.30 Consequently, both scrips moved to trading on a Spot (T+1) basis in the Ready Market to facilitate the closing of their share transfer books.31
Their suspension from the New COT market, although temporary and according to normal practice, was significant in both timing and volume, and thereby became one of a set of independent circumstances that potentially contributed to the uncertainties in the capital markets during this critical period prior to the decline. For purposes of this analysis, we collectively refer to the PSO and PTC scrips as "GROUP B."
-- (30 In the last week of February 2005, the boards of both PSO and PTC approved the issuance of dividend payments. For PSO, the Board announced an interim cash dividend of Rs 11 per share translating into cash payout of Rs 1.9 billion to its shareholders, a dividend that was Rs 4 per share more than the prior year period. "Pakistan State Oil pay Rs 1.9 Billion All-Time High Interim Dividend" Pakistan Press International Information Services, February 22, 2005. PTC's board had recommended an unusual interim dividend payment at the rate pf Rs 2 per share. "Pakistan Shares End Higher; Telecom, Energy Stks Gain," Dow Jones Asian Equities Report February 15, 2005.)
B. EFFECTS OF SUSPENSION ON MARKET LIQUIDITY:
Historically, both PSO and PTC had been heavily traded stocks on the Karachi Stock Exchange. This trend increased in 2005 as investor interest in the shares grew with repeated reports of possible privatisation, the heavily promoted sale of stakes in the companies to foreign entities, and general positive news surrounding the two companies.
1. PAKISTAN STATE OIL (PSO):
A strong outlook for PSO coupled with privatization interests sparked very heavy trading volumes of the scrip in the Ready and COT markets in the early months of 2005. 32 In January, for example, the average daily value of Total COT for PSO was Rs 5.7 billion, representing 15.9% of the average daily volumes of the total market. These strong volumes continued in February, resulting in PSO having the heaviest average daily investment in Total COT of any single scrip. Clearly, COT availability in PSO was significant to the liquidity of the overall market.
-- (31 The KSE trading procedures defines Spot/T+1 transactions as the following: "For about 5 days before the closure of shares transfer book notified by the company, transactions are settled on T+1 basis." See: Karachi Stock Exchange website www.kse.com.pk/kse4/phps/trading/php. In-line with Spot trading relating to book closure and payment of dividends to shareholders, the CDC procedures state that spot trading is necessary, "in order to enable them to distribute the benefits accruing as a result of the corporate actions to each beneficial owner according to his entitlement." See: "CDC Operating Procedures" February 15, 2005 Central Depository Company Chapter 5: Handling of Corporate Actions 5.1: Book Closure. Similarly, the rationale of the NCSS procedures, as provided by the National Clearing Company of Pakistan Limited, states that the purpose of the Balance Order T+1 settlement cycle, "shall be used for settlement of exchange trades and non-exchange transaction in a security in which book closure has been announced by the issuer for ascertaining the names of the holders who are entitled to dividend..." National Clearing Company of Pakistan Limited, "NCSS Procedures" Amended based on 32nd Board Meeting. PSO and PTC both submitted the required C/A-1 Annexure to notify the CDC of Spot trading in advance of the trading. See: Abdul Hameed to Aftab Diwan, Letter to CDC Mar. 2, 2005. See also: Ahmed Ali Jafri to Aftab Diwan, Letter to CDC February 22, 2005.)
-- (32 "Pakistan Shares End Higher; Telecom, Energy Stks Gain," Dow Jones Asian Equities Report February 15, 2005. "Pakistan State Oil improves on record profit by 23%" The Pakistan Newswire February 21, 2005. "Pakistan PSO 1H Net PKR2.61 B Vs. PKR2.12 B Last Yr" Dow Jones Emerging Markets Report February 21, 2005. "PSO Improves on Record Profit by 23%" Frontier Star February 21, 2005. "Pakistan State Oil pay Rs 1.9 Billion All-Time High Interim Dividend" Pakistan Press International Information Services February 22, 2005. "Pakistan Shares End Higher; Telecom, Energy Stks Gain," Dow Jones Asian Equities Report February 15, 2005. "Fresh EOIs Invited for Privatisation of PSO by March 4" The Pakistan Newswire January 13, 2005.)
PSO moved to trading Spot on March 10, 2005, thus temporarily suspending its participation in the New COT market for five trading days until March 17th. As shown in Chart 5, the impact of the temporary suspension of PSO reduced the level of Total COT in the market by approximately Rs 4 billion, or 12%.33
2. PAKISTAN TELECOMMUNICATIONS COMPANY LIMITED (PTC):
Similar to the high trading volumes experienced by PSO, heavy trading volumes in shares of PTC were attributed to the looming privatisation interests as the government committed to sell a 26% stake in the nation's leading telecomm provider, coupled with the fact that high-earnings expectations were anticipated by market analysts for the company. 34
Trading volumes in PTC in both the Ready and COT markets were also relatively heavy in the first months of 2005. In January 2005, the average daily value of Total COT was Rs 3.2 billion, increasing in February to Rs 4.9 billion per day, or about 13% of the total market. These volumes ranked PTC as the fourth heaviest in Total COT of all COT- eligible scrips.35
PTC moved to trading Spot on March 15, 2005, and temporarily suspended its participation in the COT market for five trading days. It resumed participation in COT on March 22nd, during the middle of the market's freefall. As shown in Chart 6, the impact of the temporary suspension of PTC from the New COT market reduced the level of Total COT in the market by about Rs 3 billion, or 10%.36
3. COMBINED IMPACT ON COT MARKET:
Undoubtedly, the temporary suspension of COT for both PSO and PTC during the approximate same time period had a substantial impact on the COT market as a whole, and may well have been a major contributor to the market's instability. Their combined temporary suspension reduced the level of Total COT in the market by about Rs 7 billion, or slightly more than 21%. An additional noteworthy fact is that this suspension of newly available COT occurred at a time when each week, scrips with larger and more significant levels of COT were exiting the COT market because of regulatory mandate.
-- (33 KSE Unreleased/Open Market COT Daily Reports, January 2005 - Mar. 2005. Karachi Stock Exchange website: www.kse.com.pk Path: COT History, 2005. )
-- (34 "Privatisation Affairs" Telecommunications International Edition December 2004. "VSNL Interested in PTCL Privatisation" World Markets Analysis, January 10, 2005. "Pakistan Shares End at Record High; PTCL Leads Gainers," Dow Jones Asia Equities Report January 26, 2005. "Pakistan Shares End Up; PTCL, Pakistan State Oil Lead" Dow Jones Asia Equities Report January 10, 2005.)
-- 35 Ibid.
-- 36 Ibid.
-- Chart 5 - Daily Values of Total and New COT in PSO, KSE, In Rupees Billions, For the Period March 1 to March 15, 2005
Graph Notes: The move to spot trading on March 10th temporarily suspended trading in COT for PSO. This had an immediate downward affect of about Rs 4 billion on the levels of liquidity in the market.
-- Chart 6 - Daily Values of Total and New COT in PTC, KSE, In Rupees Billions, For the Period March 1 to March 15, 2005
Graph Notes: The move to spot trading on March 15th temporarily suspended trading in COT for PTC. This had an immediate downward affect of about Rs 3 billion on the levels of liquidity in the market.
4. CONCLUSION:
Similar to the group of scrips subject to the COT phase-out prior to mid-March 2005, we find that the temporary suspension of New COT trading for PSO and PTC was not due to voluntary or manipulative pull-out of COT by lenders. In fact, this COT suspension was, in both cases, a company-directed suspension for administrative reasons in the normal course of business.37 No actions of any broker and/or COT lender can be attributed to the temporary suspension of New COT for PSO and PTC for this period, nor could anyone have foreseen the unfortunate timing of such suspensions in terms of overall liquidity conditions existing at the time.
V. ACTIVE COT-ELIGIBLE SCRIPS
A. INTRODUCTION:
Nine scrips eligible for COT fall outside of our analytical GROUPS A and B. Unlike the other scrips, these were not subject to any regulated or company-directed withdrawal or phase-out of COT prior to the market's steep decline. For ease of reference, we refer to these scrips collectively as "GROUP C."38.
Entering 2005, the scrips within GROUP C represented the majority of the market's total investment in regulated COT.
-- As shown on Chart 7, Total COT in the nine scrips totalled Rs 19.7 billion on January 3, 2005, which represented 54% of the total market. Not surprisingly, the proportion of this group's Total COT relative to the overall market increased as COT eligibility in scrips outside of this group was phased-out, or temporarily suspended. On March 15, 2005, for example, at the time when both PSO and PTC were trading Spot, the percentage of Total COT represented by the nine scrips of GROUP C ballooned to 81% (or Rs 23.6 billion) of the market's Rs 29.0 billion.39
-- The nine scrips within GROUP C also generally accounted for a significant portion of daily trading volumes on the Ready Market. Between January 3, 2005 and March 15, 2005, trading in these scrips represented 49% of the total value of shares traded on the KSE, and as shown in Chart 11, played a large role in dictating the overall daily movements of the market. Clearly, the importance of these scrips to the market's overall sentiments and daily movements was significant.40
-- (37 For example, see Taskforce Report (June 2005), paras 28 and 54.)
-- (38 The nine scrips comprising GROUP C represented the final nine COT-eligible scrips to be phased out as according to the SECP's phase-out schedule. They are: BOP, DGKC, FFBL, HUBC, ICI, MLCF, NBP, OGDC and POL. SECP Directive, September 3, 2004. See Appendix A.)
-- (39 KSE Unreleased/Open Market COT Daily Reports, January 2005 to Mar. 2005. Karachi Stock Exchange website: www.kse.com.pk Path: COT History, 2005.)
-- Chart 7 - Daily Values of Total COT for Entire Market and Group C Scrips, KSE, In Rupees Billions, For the Period January 3, 2005 to March 15, 2005
Graph Notes: Total COT for Group C scrips increased in the weeks prior to the market's decline while Total COT for the market decreased (due to the withdrawal/suspension of COT for scrips being phased-out or going Spot)., demonstrating that the decline was not attributable to the scrips within Group C.
B. EXAMINATION OF COT ACTIVITY AND TRENDS:
Our analysis included an examination of the daily values of New and Total COT of the scrips within GROUP C for evidence of any contraction of the availability of COT in the weeks leading up to the market's decline. As none of the scrips within GROUP C were scheduled for phase-out until after March 15th, evidence of a decrease in COT investment within these scrips prior to that date might suggest a possible intentional pull-back of liquidity in the regulated COT market.
-- (40 KSE Market Transaction Data, January 2005 to Mar. 2005. Worthy of note is that OGDC, a member of GROUP C, was the heavyweight of the KSE 100, representing on some days more than 50% of its day-to- day movement. KSE 100 Daily Data.)
1. CONTRIBUTION TO TOTAL INVESTMENT IN COT:
As shown in Chart 8, Total COT for the scrips within GROUP C, in general, rose steadily from January 3, 2005 to March 15, 2005, moving from Rs 19.7 billion to Rs 23.7 billion, an increase of 19.8%. More noteworthy is that during this period, while the market's overall value of Total COT declined, Total COT in GROUP C scrips slightly increased, from Rs 22.4 billion to Rs 23.6 billion.41
2. DAILY AVAILABILITY OF NEW COT:
AN EXAMINATION OF DAILY TRANSACTIONS IN NEW COT SHOWS SIMILAR RESULTS. FOCUSING SPECIFICALLY ON THE PERIOD FROM MARCH 1 TO MARCH 15, 2005, WE FOUND THAT:
-- The daily transactions of New COT for GROUP C, as shown in Chart 8, increased as a whole, moving from Rs 9.7 billion on March 1 to Rs 13.4 billion on March 15, an increase of almost Rs 4 billion.42
-- The level of daily transactions of New COT for four of the five trading days prior to the market's decline on March 16th experienced trading volumes in excess of the average daily trading volume of New COT for the group over the preceding six week period.43
-- As shown in Chart 9, investment in New COT for each of the individual scrips within GROUP C generally followed the trend of the group as a whole. By March 15, the day before the market began its decline, all nine scrips were experiencing higher daily volumes (in Rupees) of New COT than at the beginning of the month. Moreover, the daily volume of New COT for eight of the nine scrips on March 15th was at or higher than the average daily level of New COT for the prior two weeks in March 2005.44
-- Accordingly, we found no indication that the availability of New COT for any of these scrips, on the whole, was withdrawn from the market. These findings refute the allegation and commonly-held perception that COT was voluntarily withdrawn from the market by brokers and/or COT lenders in the days immediately prior to the market's fall.45
-- (41 KSE Market Transaction Data, January 2005 to Mar. 2005.)
-- (42 KSE Market Transaction Data, Mar. 1 to Mar. 15, 2005.)
-- (43 Daily transactions of New COT for GROUP C scrips were Rs 13.1 billion on March 9th, Rs 13.3 billion on March 10th, Rs 11.6 billion on March 11th, Rs 13.6 billion on March 14th, and Rs 13.4 billion on March 15th. The average level of New COT transactions from February 1, 2005 to Mar, 15, 2005 was Rs 12.7 billion. KSE Market Transaction Data, Mar. 1 to Mar. 15, 2005.)
-- (44 KSE Market Transaction Data, Mar. 1 to Mar. 15, 2005.)
-- Chart 8 - Daily Values of Total and New COT in Group C Scrips, KSE, In Rupees Billions, For the Period January 3, 2005 to March 15, 2005
Graph Notes: Total investment in New and Total COT for Group C scrips actually increased during the week immediately preceding March 16, 2005, the start of the market's decline. Investment in New COT increased from Rs 10.5 billion to Rs 13.4 billion between March 7 and March 15, 2005.
-- (45 We note the possibility that one or more individual lenders may have pulled back from the COT market between Mar. 1 and Mar. 15, 2005, however, the COT trend levels indicate that any departure was replaced by COT from new lenders or from a greater participation by existing lenders.)
-- Chart 9 - Daily Values of New COT for Group C Scrips, By Scrip, KSE, In Rupees Billions, For the Period March 1 to March 15, 2005
Graph Notes: Each individual scrip included in Group C experienced increasing levels of investment in New COT during the two weeks preceding March 15, 2005.
3. VARIABILITY AND CYCLICALITY OF NEW COT:
-- As described earlier in this Part, the volume of daily transactions in New COT during 2004 and early 2005 was highly cyclical and experienced wide variations in relatively short time spans. Frequent downward trends in daily transactions of New COT over multiple daily trading periods were not uncommon. Yet a comparison of daily transactional volumes of New COT to Ready Market trades shows that any downward trends that may be present from time to time did not appear to directly or negatively influence the daily trading volumes of the same scrips.46
-- As shown in Chart 8, New COT for the scrips comprising GROUP C continued a cyclical pattern during early 2005 until the market's decline in mid-March 2005. For example, daily New COT in January ranged from a high of Rs 15.6 on January 6th to a low of Rs
-- 6.2 billion on January 31st, a fluctuation of Rs 9.4 billion, or 60% from the month's high. Similarly, daily New COT in February ranged from a low of Rs 7.3 billion on February 1st to a high of Rs 17.9 billion on February 14th, a change of Rs 10.6 billion, and again, approximately a 60% fluctuation. Nonetheless, despite the severe fluctuations, daily trading volumes of these scrips on the Ready Market remained high and continued to increase, as shown in Chart 10.
-- (46 See Chart B-2 in Appendix B comparing daily levels of New COT investment to Ready Market trading volumes (in share values). KSE Market Transaction Data, July 2004 to Mar. 2005.)
-- Chart 10 - Daily Values of Ready Market Trades Compared to New COT for Group C Scrips, KSE, In Rupees Billions, For the Period January 3, 2005 to March 15, 2005
Graph Notes: Despite fluctuations in New COT for Group C scrips, total Ready Market transactions for these same scrips remained high and continued to increase up until March 15, 2005.
4. TRENDS IN BROKER-INITIATED LEVELS OF COT INVESTMENT:
-- The absence of any noticeable withdrawal of funds in the New COT market largely eliminates the need to further analyse the data. Nevertheless, given the turmoil and rumours surrounding the market's decline, we examined the COT trading activities at the broker level to determine who, if any, may have voluntarily withdrawn sizeable funds from the COT market in the weeks prior to the market decline.47
-- As shown in Chart 11, the daily purchases of New COT by the eleven brokers with the largest trading volumes in the COT market did not generally decrease between March 1 and March 15. Collectively, these eleven brokers represented a large majority of the total purchases of New COT during this period, any one of which traded daily in substantial volumes of COT. Yet the data shows no indication of a substantial withdrawal of funds by any of these major brokers during this period.48
-- (47 Because the total levels of investment in New COT did not generally decline within Group C scrips in the two weeks prior to March 16, 2005, any substantial withdrawal of investment funds from regulated COT market by a broker (or brokers) would have been replaced by new funds from another broker (or brokers). Nevertheless, an examination of New COT activity at the broker level during this period might possibly uncover attempts, albeit unsuccessful, by one or more brokers to manipulate the market.)
-- In addition, we conducted a limited examination of the client-level trading data acquired from the two largest brokers trading in the COT market-Aqeel Karim Dhedhi Securities (Pvt) Ltd ("AKD") and Arif Habib Securities Limited ("AHS")-to identify, where possible, the underlying source of funds of New COT.49 The analysis was conducted to determine whether COT funding was concentrated among a relatively few lenders and whether the brokers themselves provided a meaningful portion of total funds lent.
-- The data shows that for the period March 1 to March 15, 2005, funds provided for New COT through the two largest providers were heavily concentrated among relatively few lenders. In the case of AKD, over 80% of its New COT purchases were provided by only seven lenders.50 Two of the seven clients were major banks accounting for 50% of the total purchases. In the case of AHS, a total of thirteen banks or mutual funds comprised 80% of AHS's total COT purchased.51 In cases where clients are concentrated, the risk of manipulation is mitigated by the fact that the large majority of the lenders were regulated third-party banks, mutual funds or other financial institutions that are seemingly independent of the brokers and subject to separate financial and regulatory controls.52
-- (48 The eleven largest brokers were determined based on Total COT values for the period Mar. 1, 2005 to Mar. 15, 2005. We note the unusual, one-day temporary drop in New COT purchase transactions by Aqeel Karim Dhedhi Securities, yet this decrease appears spread across a number of individual financiers and is mitigated by the increase in New COT from March 4 to March 15, 2005. See: KSE Market Transaction Data Mar. 1 2005 to Mar. 15 2005.)
-- (49 AKD and AHS accounted for 19.8% and 10.2%, respectively, (collectively 30%) of the New COT investment purchased for GROUP C scrips during the period March 1 to March 15, 2005. KSE Market Transaction Data, Mar. 1 - Mar. 15, 2005.)
-- (50 KSE Market Transaction Data, Mar. 1 - Mar. 15, 2005. Trading data, Aqeel Karim Dhedhi Securities, Mar. 1 - Mar. 15, 2005.)
-- (51 KSE Market Transaction Data, Mar. 1 - Mar. 15, 2005. Arif Habib Securities Client Listing, Mar. 1 - Mar. 15, 2005.)
-- (52 We note that on February 26, 2005, the State Bank of Pakistan (SBP) issued a circular through their Banking Policy Department, capping the amount of badla lending by each of the nation's banks and Development Finance Institutions (DFIs) falling under the regulatory authority of SBP. This restriction was a measure used in co-ordination with the phase-out plan of COT. The circular explicitly stated that COT exposure for all banks and DFIs should not exceed, in any scrip, their respective COT exposures in the corresponding scrips as of February 25, 2005. Although the effects of this directive have not been quantified, the possibility exists that this bank regulation also played a role in limiting the availability of COT that might have been made available for the remaining COT-eligible scrips. See: BPD Circular No 5 of 2005 "Replacement of COT with Margin Financing" Muhammad Ashraf Khan, Sr. Joint Director.)
-- Chart 11 - Daily Purchases of New COT for Group C Scrips, By Brokers Representing Lenders, KSE, In Rupees Millions, For the Period March 1 to March 15, 2005
GRAPH NOTES: The top brokers through which COT was provided generally experienced slight increases in New COT during the first two weeks of March 2005.
-- For each broker examined, it did not appear that proprietary accounts or broker- controlled banks or mutual funds played a significant part in providing regulated COT financing. In our view, this reduces the broker's control and influence in the short-term over the supply or withdrawal of COT investment funds.53
5. COMMENT ON COT INVESTMENT AT LAHORE STOCK EXCHANGE:
-- Although the focus of this Part is entirely on certain events impacting COT investment on the KSE, we also briefly analysed, for comparison purposes, the trends of New COT on the Lahore Stock Exchange ("LSE") in the nine COT-eligible scrips comprising GROUP C during the first two weeks of March 2005. As shown in Chart 12, our analysis shows the same upward trend in New COT at the LSE as found at the KSE, indicating the absence of a systemic and voluntary withdrawal of COT for these active scrips.54
-- (53 The identification of underlying lenders was based entirely on client-level data obtained from the brokers. We did not perform any confirmation procedures to validate the data or client names including reviewing underlying transaction documentation such as confirmation slips or trade tickets. On July 28, 2006 the SECP implemented regulations requiring Pakistan's three exchanges to ensure that brokers identify, via the use of a Unique Identification Number, the identity of the individual behind a stock market transaction. SECP letter to KSE, LSE and ISE, August 3, 2006.)
-- Chart 12 - Daily Purchases of New COT for Group C Scrips, Lahore Stock Exchange, In Rupees Billions, For the Period March 1 to March 15, 2005.
Graph Notes: Consistent with the KSE, investment in New COT on the LSE for Group C scrips also increased during the first two weeks of March 2005.
6. IN-HOUSE BADLA:
A major remaining issue area concerning whether or not COT funds were withdrawn as part of a scheme to possibly manipulate the market is the possible role of unregulated "in- house" Badla.
-- Although no accurate, authoritative market size estimates exist, various news articles and market experts surmise that the in-house market may have approached volumes (of amounts loaned) as large, if not much larger than the regulated market itself.55
-- (54 LSE Market Transaction Data, January 3 - Mar. 15, 2005, LSE Website www.lahorestock.com. Interestingly, daily trading in New COT for Group C scrips on LSE, as shown in Chart 12, did not experience the high variability from day-to-day as reflected in the COT trading on the KSE.)
-- (55 "KSE Big Fish Vying to Arm Speculators" The International News: www.thenews.com.pk/print1.asp?id=24865; Interview with SECP Staff. Recent events demonstrate the difficulty in ascertaining the full amount of the market's outstanding in-house Badla. For example, in conjunction with the recent new regulations to ban in-house Badla, brokers were required by the SECP to report the outstanding balances of in-house Badla. In October 2006, 45 brokers reported a total of Rs 9 billion of in-house Badla to the SECP (SECP Information). In the same article, in-house Badla was estimated as high as Rs 90 billion (Dawn, November 18, 2006, pg 9)
-- (56 Interview of and statements by independent financial statement auditors familiar with the accounting, record keeping and financial statement reporting of in-house Badla.)
-- Diligence has not been able to obtain any useful public or other data or information from the market or independent third parties regarding the quantities and activities of in-house Badla existing in the days and weeks prior to the market's decline in March 2005. Diligence has learned from Pakistani auditors and accountants familiar with in-house broker financing activities and the recording of those activities in a broker's books and records, that quality, accurate and reliable figures on in-house Badla on a daily basis are not readily available and indistinguishable in the books from the broker's regulated COT.
-- It would therefore be extremely difficult and very costly to extract and reconcile this financing source, and would also be virtually impossible to quantify or to verify its accuracy or completeness on such a wide scale.
-- From a high-level analytical perspective, we note that a variety of issues effectively preclude a normal detailed forensic review of this information. First, since this market is by definition, "in-house," there is no central KSE or other exchange repository of transactional information from which to access and analyse regularly recorded information. There is no data existing in a uniform format in a professionally designed and operated control environment to establish reliable data trends and findings.
-- To undertake a comprehensive review of the possible role of in-house Badla would therefore require the acquisition, loading and analysis of disparate data types and records from each and every broker (and/or possibly involved third parties) providing in-house Badla. Second, assuming the unlikely ability to acquire this core data, it is further unlikely that there would be any control totals or other mechanisms for use in corroborating the accuracy and completeness of whatever data was provided by the brokers (and/or possibly involved third parties). Any resulting analysis would therefore be suspect, because of the questions surrounding whether or not the data was appropriate, accurate and complete.56
-- In summary, this market lacks transparency and accountability. Therefore, assuming the amounts of in-house Badla involved are in fact substantial, as posited by media and market experts, any possible broker manipulation of scrip-related financing would have been more likely to occur, if at all, in this unregulated and opaque financing environment than in the regulated COT market.
VI. SUMMARY AND CONCLUSIONS ON THE WITHDRAWAL OF REGULATED COT:
In summary, our findings support the observations of the Taskforce and others on a central point: there was a significant decrease in overall investment in the regulated COT market (concerning the KSE) in the days and weeks prior to the market's March 2005 decline. Whether the decline in COT played a key role in the market's rapid descent, as alleged by the Taskforce and others, was not the subject of this Report, although certainly one cannot dismiss the importance of its possible impact.
Our findings, however, do not support the assertion that the withdrawal of COT was the product of a manipulative scheme by brokers and COT lenders to propel the market into a pronounced freefall to reap illicit gains on possibly illegal short positions.
Conversely, we find that the withdrawals were directly linked to identifiable and quantifiable regulatory and/or self-imposed (by certain companies) factors. We do not find credible evidence that the withdrawal of funds from the regulated COT market was engineered by certain brokers or other financial participants, or was otherwise manipulative in nature.
THE SUBSTANTIAL DATA COLLECTED AND ANALYZED AS PART OF THIS EFFORT LEADS TO TWO FUNDAMENTAL CONCLUSIONS CONCERNING THE WITHDRAWAL OF FUNDS FROM THE COT MARKET:
-- 1) The net drop in Total COT investment from its peak on February 18 to just prior to the market's decline on March 16 of Rs 12 billion was entirely attributable to the withdrawal of COT investment from i) the scrips phased-out of COT eligibility and ii) the two scrips temporarily moving to Spot and suspending their COT eligibility (See Sections IV and V); and
-- 2) The level of New COT for the scrips not subject to a regulated or self-imposed withdrawal for this same February and March period was cyclical (essentially consistent with historical patterns) and, more significantly, did not appear to adversely impact Ready Market trading as the daily trading volumes of these scrips on the Ready Market for this period remained high and continued to increase. (See Section VI).
Finally, although this Part does not probe the question of what precisely caused the market decline, we note and cannot ignore a convergence of multiple independent and identifiable events within a short time frame prior to the Ready Market's decline that individually and collectively restricted the availability of COT and strongly influenced market sentiments. We also note the strong influence likely played by the skyrocketing trades and record open and precarious positions in the Futures markets.
1. SUMMARY AND CONCLUSIONS PRESENTED GRAPHICALLY:
Presented below are additional graphical representations of our findings and conclusions related to the withdrawal of regulated COT from the KSE market.
In Chart 13, we present a side-by-side comparison of the daily levels of Total COT for each of the featured analytical groups: GROUP A, GROUP B and GROUP C. As shown in the chart, the daily levels of Total COT for GROUPS A and B, the scrips for which COT was phased-out or temporarily suspended, declined leading up to the weeks preceding the market's steep decline. Conversely, Total COT for GROUP C, scrips which continued to be eligible for and actively trading in COT, generally increased during the same time period.
In Chart 14, we present the same data of Total COT by analytical groups, but the data is displayed in a format that illustrates the relative proportions of the market's Total COT that are represented by the three analytical groups. As shown in the chart, Total COT of GROUP C represents the largest portion of the market's Total COT, and is thus an influential factor of the market's total liquidity.
For this group we found no indications of COT being withdrawn prior to the market's decline. Also reflected in the chart is the underlying basis for the decrease in the aggregate level of Total COT, which we found was entirely attributable to the mandated or temporary phase-out of COT by the scrips in GROUPS A and B.
-- Charts 15 and 16 follow the same formats as Charts 13 and 14, respectively, except that the data in Charts 15 and 16 represent investment in New COT (not Total COT) across the three analytical groups. Although the data set changes for these two charts, the patterns are similar. As shown in the charts, New COT for GROUPS A and B decline, as a result of their respective regulated or self-imposed withdrawal from the COT market, whereas New COT for GROUP C increases, refuting the allegations that there was a co-ordinated scheme to withdraw regulated financing from the market.
-- Chart 13 - Daily Values of Total COT Comparing Scrip Groups A, B and C Side-by-Side, KSE, In Rupees Billions, For the Period January 3 to March 15, 2005
-- Chart 14 - Daily Values of Total Outstanding COT Divided Into Scrip Groups A, B and C, KSE, In Rupees Billions, For the Period January 3 to March 15, 2005
-- Chart 15 - Daily Values of New COT Comparing Scrip Groups A, B and C Side-by-Side, KSE, In Rupees Billions, For the Period January 3 to March 15, 2005
-- Chart 16 - Daily Values of New COT Divided Into Scrip Groups A, B and C, KSE, In Rupees Billions, For the Period January 3 to March 15, 2005
VII. OTHER FINDINGS:
In the course of our on-going forensic investigation, we examined millions of trading and transactional records and events across the Ready, Futures and COT markets. Although outside of the central focus of this Part, we present certain findings and trends in this concluding section that we believe are relevant to the general subject of market liquidity.
A. TRADING PATTERNS IN FUTURES MARKET:
In the months leading up to the KSE 100's peak on March 15, 2005, trading volumes in the KSE's Futures Market rapidly accelerated. As shown in Chart 17, by March 10, 2005 (just a few days before the market's decline), trading volumes at the Futures counter, which historically have been a fraction of the volumes in the Ready Market, shot past the trading volumes in the Ready Market and reached unprecedented levels.
What exactly caused this abnormal shift of interest to the Futures Market has yet to be definitively investigated, but some have attributed the shift to the decrease in available COT in the Ready Market due to the COT phase-out, and the lack of a sufficient alternative in margin financing, as weak investors sought more purchase opportunities in a rapidly rising market.
Also noteworthy is the heightened and unparalleled level of open positions in the Futures Market, as shown in Chart 18. With the extraordinary levels of leverage in the COT markets, the combined leverage in the markets in the days immediately preceding the steep decline can not be dismissed or ignored, and may have played a critical role in the market's instability at that time.
-- Chart 17 - Daily Trade Volumes in Ready and Futures Market, KSE, In Rupees Billions, For the Period October 1, 2004 to March 24, 2005
-- Chart 18 - Daily Totals of Open Futures Positions, KSE, For the Period October 1, 2004 to March 24, 2005
B. COT TRENDS DURING MARKET'S DECLINE:
Earlier in this Part, we noted that New COT for actively trading COT-eligible scrips (scrips that had not been phased-out or temporarily moved to trading Spot) generally increased during the two weeks preceding March 16th. We also described how all major brokers representing the purchasers of New COT, individually and as a group, followed the same pattern of slightly increasing COT funding over the same two-week period. We did not identify any one broker or group of brokers acting in concert contrary to this general market trend during this period.
We also performed a limited review of the COT market patterns between March 16 and March 24, the period immediately following the KSE 100's peak, and a period of precarious turnover and price instability in the markets. The purchase transaction data by the largest brokers in the COT market are shown in Chart 19. The data shows that the largest brokers transacting COT purchases appeared to follow the same general trends of the overall market. The data does not indicate or suggest that any one broker or group of brokers appeared to have manipulated the COT market or acted in concert contrary to the general market trend.57.
The percentage of New COT lending as compared to the volume of trading in the Ready Market is shown in Chart 20. Although New COT declined that week, this appears to be a function of demand, as trading volumes in the Ready Market declined similarly during the same period. There appears to be no indication that the amount of New COT relative to trading volumes in the Ready Market declined, but rather, it remained steady.
As previously noted, the KSE did not systematically retain information related to orders placed on the exchange. Because order information provides details on bid and offer volumes and prices, it is an accurate gauge of the supply and demand forces that drive the ultimate executed trades. In reference to the COT analysis above, COT order information would have been instrumental in our ability to determine whether decreases in New COT during the period March 16 to March 24 were a result of a decrease in financier supply or, alternatively, were a function of a decrease in demand related to the general downturn in the market.
-- (57 KSE Market Transaction Data, Mar. 16, 2005 - Mar. 24, 2005.)
-- Chart 19 - Daily Values of New COT Purchases By Top Brokers, Representing Lenders, KSE, In Rupees Millions, For the Period March 16 to March 24, 2005
Graph Notes: New COT provided through the largest brokers showed generally uniform decreasing trends consistent with the general market downturn.
-- Chart 20 - Daily Percentage of New COT Purchases to Volume of Trading in Ready Market by Scrip Group, In Rupees Millions, For the Period March 1 to March 18, 2005
GRAPH NOTES: New COT as a percentage of volume of trading in the Ready Market remained steady during the critical days immediately following the KSE 100's peak on March 15th.
GLOSSARY:
BOOK CLOSURE: Period of completing and closing business journals, ledgers, and other accounting records (including the transfer of revenue and expense accounts) at the end of a period in preparation of a corporate action such as a payment of dividend, issuance of bonus shares, stock split, merger, acquisition, etc.
COT: Carry Over Transaction (also known as "Carry Over Trade" or badla financing) was a financing mechanism providing investors and market participants in the Pakistani securities markets with funding to leverage their investments. COT enabled investors to "carry over" their positions in the market without taking delivery, thus deferring settlement. COT was replaced with the Continuous Funding System in August 2005.
NEW COT: As used in this Part represents the value (in Rupees) of new carry over transactions transacted on the KSE on a given trading day. New COT is equivalent to "Open Market COT" provided on the KSE Daily Unreleased/Open Market COT reports.
TOTAL COT: As used in this Part, Total COT represents the value (in Rupees) of outstanding carry over transactions at the end of a given trading day. Total COT is the sum of unreleased carry over transactions from the previous trading day plus New COT. Total COT is equivalent to "Total COT" provided on the KSE Daily Unreleased/Open Market COT reports.
COT-ELIGIBLE SCRIP: A scrip in which COT funding was a permitted, viable method for leveraging trades.
COT BORROWER: An investor who borrows COT funding from a COT lender at the agreed COT rate in order to leverage his/her position in the market. The COT borrower is represented as the "Seller" in the COT market transaction data records, as he/she is temporary "selling" his/her Ready Market position in a given scrip to the COT lender for purposes of collateral.
COT LENDER: The provider of COT funding who agrees to make the funding available at the prevailing COT rate. This lender can be a bank, development financial institution, non-bank financial institution, a broker, etc. A COT lender can also be an individual who decides to "invest" his money in the COT market in order to realise profits afforded by the COT rate. A lender makes financing available on the COT market through a broker. The COT lender is represented as the "Buyer" in the COT market transaction data records as he/she is temporarily "buying", for purposes of collateral, the Ready Market scrip shares which are the subject of the COT financing.
IN-HOUSE/UNREGULATED:
COT Funding COT funding made available to investors directly by a broker through an unregulated transaction. These "off exchange" transactions are not transparent to the market and are not recorded or controlled by any exchange. In contrast to regulated COT, rates are not capped for in-house/unregulated COT funding.
KSE: KARACHI STOCK EXCHANGE:
KSE 100 INDEX: A securities market indicator for the Karachi Stock Exchange, (similar to the Dow Jones Industrial Index of the New York Stock Exchange) that aggregates the overall daily performance of 100 selected scrips.
KSE MARKET:
TRANSACTION DATA: A complete record of all individual trades executed on either the Ready or COT markets for a given trading day.
KSE UNRELEASED/ OPEN MARKET COT:
DAILY REPORTS: Daily reports produced by the KSE that define the daily values of Unreleased COT (COT carried over and not released), Open Market COT (our New COT), and Total COT (our Total COT) for each COT-eligible scrip on a given trading day.
READY MARKET: THE KSE'S T+3 TRADING MARKET.
REGULATED COT
MARKET: The COT market in which transactions consist of investors buying and selling COT funding at a regulated COT rate. Transactions in this market were transparent and subject to exchange recording and control and were regulated by the Carry Over Transactions Regulations, 1993.
SCRIP: Equivalent to a share or shares of an issuer's stock.
SECP TASKFORCE: The group of individuals commissioned on April 2, 2005 by the SECP to determine the causes underlying the securities market downturn in Pakistan in March 2005. The Task Force was chaired by Justice (Retd.) Saleem Akhtar, and also included members Dr Mohammad Zubair Khan, Shahid Hafiz Kardar, and Sultan Allana.
The Task Force issued its report to the SECP in June 2005. Spot Trading (T+1) Trading of securities in which settlement occurs within one day of the trade - usually associated with an issuer corporate action, such as a dividend payment.
I. BACKGROUND AND SCOPE: A wash trade is defined as "a purchase and sale of a security either simultaneously or within a short period of time by a single investor or by two or more parties conspiring to create artificial market activity in order to profit from a rise in the security's price".1 We understand that the SECP takes the position that wash trades are a direct violation of Section 17(a) of the Securities and Exchange Ordinance, 1969.
The Taskforce identified the prolific use of wash trades as a critical component in the overall scheme perpetrated by certain brokers to "pump" the market prior to its precipitous decline. Specifically, the Taskforce concluded:
1) "The analysis of stock market data helped identify a number of potential cases of market abuse where players had undertaken "wash trades"; either for the same client or a series of common clients across brokers to "pump" the market.
Analysis shows that the brokers and their clients largely dealt with each other in groups or sub groups at both broker and client level."2
2) "Large volumes were also traded between clients of the same brokerages and there were numerous instances of the same client or house account of a broker being both buyer and seller, in violation of rules, raising concerns about the sanctity of these transactions."3
The Taskforce called for its identified wash trade abuses to be further investigated by the SECP. As described in detail below, Diligence undertook several steps in response to the Taskforce's request, namely reviewing:
1) The KSE trading data for intra-broker wash trading activities, or wash trades by same clients within one broker.
2) The KSE trading data for inter-broker wash trading activities, or wash trades by same clients across more than one broker.
3) The client-level detailed trading data for a sample of four large-volume brokers suspected of participating in excessive wash trading, to determine if any additional illegal wash trading had occurred.
(1 Barron's- Dictionary of Investment Terms - John Downs and Jordan Elliott Goodman, 6th Edition - New York: Barron's, 2003. The Taskforce defined a wash trade similarly as "an illegal stock trading practice whereby an investor simultaneously buys and sells shares in a company through two different brokers. Such a trade enhances the activity in the stock, giving the impression of active trading without any change in beneficial ownership, a clear violation of Section 17 of the SEO, 1969." Taskforce Report, fn 10.)
-- (2 Taskforce Report, para 23.)
-- (3 Ibid., para 24.)
II. REVIEW OF TASKFORCE FINDINGS A. INTRA-BROKER WASH TRADES:
The taskforce relied exclusively on client codes represented in KSE trading data to identify purported intra-broker wash trades included as Appendix VIII to its report.4.
To confirm the accuracy of the methodology employed by the Taskforce, we compared the client codes represented in the KSE trading data for several large brokers to the client information from the broker's back-office trading data and identified a number of instances in which certain trades were inappropriately categorized as wash trades by the Taskforce. The following is one such example:
Row 10 of Taskforce Appendix VIII indicates that client 013758 at broker 128 (KASB Securities) transacted wash trades of 250,000 shares of OGDC during March 2005.
Based on our review of the KSE data, these 250,000 shares were made up of four distinct trades, the details of which are listed below in Chart 1. Chart 1 - KSE data for select purported Wash trades identified by Taskforce
==========================================================================================

Ticket No       Date      Broker    Buyer      Seller      Scrip      Shares         Value

==========================================================================================

91452669      09-Mar-05      128    013758     013758   OGDC-MAR      50,000     8,050,000

91452959      09-Mar-05      128    013758     013758   OGDC-MAR      50,000     8,050,000

91470891      09-Mar-05      128    013758     013758   OGDC-MAR      50,000     8,042,500

92329569      14-Mar-05      128    013758     013758   OGDC-MAR     100,000    17,950,000

==========================================================================================
In our review of trade data acquired directly from KASB, we noted that the underlying parties to these transactions were in fact not the same individuals and that the transactions were therefore not wash trades. Chart 2 below includes details obtained directly from KASB trading data.
-- (4 Diligence must note that although the Taskforce, paragraph 23 of its report, described the trades in Appendix VIII as where "the investor simultaneously buys and sells shares in a company through two different brokers" (emphasis added), the trades presented in Appendix VIII are purported wash trades of the same client within the same broker.
CHART 2- KASB TRADE DATA ON THE SAME FOUR TRADES:
=============================================================

Ticket No     Buy or Sell    Client      Shares   Client Name

91452669          B          02333       50,000    [redacted]

91452669          S          03758       50,000    [redacted]

91452959          S          03758       50,000    [redacted]

91452959          B          02334       50,000    [redacted]

91470891          B          03866       50,000    [redacted]

91470891          S          03758       50,000    [redacted]

92329569          B          04182      100,000    [redacted]

92329569          S          03758      100,000    [redacted]

=============================================================
During the course of our investigation, we determined that the client codes contained in the KSE's trading data are at times incomplete and inconsistent, making it difficult to identify with certainty and accuracy the investors underlying the market transactions. This limitation of the KSE data, as demonstrated by the example above, calls into question the Taskforce's reliance on the KSE data's client codes as prima facie to characterize the trades identified in Appendix VIII as wash trades.
Until just recently, brokers were not required to use a unique client code identifying system to consistently and accurately track client information of this kind. Therefore, the client codes submitted by brokers to the exchange through the trading system, and consequently the data provided to us by the KSE, cannot be relied upon, without substantial additional corroboration, for purposes of precisely identifying investors.
During the second half of 2005, we understand that the SECP issued Show Cause Notices to all of the brokers with trades listed on Appendix VIII, requesting responses to wash trade allegations as originally put forth by the Taskforce.
We reviewed certain minutes of the SECP adjudication hearings related to a sample of the Show Cause Notices, and in particular we reviewed the minutes related to the hearing concerning possible wash trade abuses involving KASB.5 We noted that the explanations provided by KASB, and accepted by SECP, for the type of trade detailed in the example above conformed with our conclusion that the Taskforce had erred in asserting that all trades included in its Appendix VIII were wash trades.
However, the SECP concluded, and many brokers agreed, that certain trades identified by the Taskforce were in fact trades in which the buyer and seller were one in the same. It appears, based on conclusions reached by SECP adjudicators however, that a preponderance of these trades may have been placed inadvertently without manipulative intent.6
-- (5 Minutes of Hearing in the Matter of Show Cause Notice dated 23 August 2005 issued to KASB (7 September 2005).
B. INTER-BROKER WASH TRADES: In further support of its conclusions on wash trades, the Taskforce presented an analysis of "inter-trading" between several "top brokers." The graphical analysis7 details the trading relationships in shares of OGDC, on a broker-level, between seven brokers.
As a preliminary matter, it is unclear to Diligence why the Taskforce used a diagram of partial trades of scrip between different clients among different brokers as a graphical representation of large volumes of wash trades. Investors trading on the KSE must use a broker to effect a stock market transaction.
That any number of brokers, particularly the larger ones, have a significant amount of trading activity between one another is not surprising, is not indicative of wash trading, and is, in fact, quite normal and expected. Further, that certain trades between individual investors occur within the same broker is also to be expected, particularly within brokers that count thousands of investing clients.
Additionally, we find three significant flaws in the Taskforce's analysis. First, the Taskforce report highlighted the fact that for these seven brokers, there appeared to be a correlation in the amount of shares purchased and sold. This analysis was remiss in that it did not take into account the actual underlying clients involved in these trades.
In the case of Akeel Karim Dhedhi Securities ("AKD") trading with Muhamad Anas Kapadia ("MAK") for example, close to 500 AKD clients accounted for the OGDC trades between these two brokers. To believe that AKD and MAK conspired to perpetrate fraud would require one to believe that the 500 clients at AKD may have also conspired with MAK clients to enter into wash trades of 3.7 million shares. 8 In our opinion, this scenario would be very unlikely. It is impossible to reach such a conclusion without a detailed review of the underlying clients and the trading patterns among them.
Second, successfully executed wash trades serve the purpose of temporarily hyping the market and raising stock prices within a very short period time (measured in minutes). Therefore, wash trade analyses must be performed on an exceptionally granular level, preferably on a trade by trade basis.
We believe that the analysis of summary trading data aggregated over a period of one month is not representative of individual client trading behavior and cannot accurately identify potential wash trades.
Third, the absence of a universal identification coding system for investors renders it virtually impossible from using only KSE data to identify the same clients across different brokers. Without a universal identification coding system in place, in order to effectively and completely analyze wash trades within and across brokers in light of the limitations in the KSE data, one would need to review and compare the detailed back- office trading data of each and every broker to accurately identify the underlying clients, as many investors have accounts at numerous brokers.9.
This approach is complicated and would require the collection and examination of back-office trading data from an extraordinarily large number of brokerages to be meaningful. Even then, due to inconsistencies in names and spellings, and the requirement to manually confirm that clients across different brokers are one and the same through additional verification such as addresses or identification numbers would render virtually impossible the formation of any reliable conclusions on the potential wash trades between brokers.10.
Based on the above, we believe that the conclusions drawn by the Taskforce relating to inter-broker wash trades were premature and were not based on sound empirical evidence. We believe that any successful analysis of wash trades would have had to have been performed at the client level and on an individual trade level to have been effective.
-- (6 The SECP informed Diligence that based on information gleaned from their adjudication of the Show Cause Notices the majority of the trades characterized by the Taskforce as wash trades were not ultimately considered wash trades by the SECP.)
-- (7 Taskforce Report, page 14.)
-- (8 For example, the chart in paragraph 24 of the Taskforce report notes that Akeel Karim Dhedhi Securities (AKD) and Muhamad Anas Kapadia (MAK) traded Rs. 3.7 million shares of OGDC with each other during the month of March 2005. We reviewed the KSE data and noted that AKD clients purchased 3.7 million shares of OGDC from MAK clients and MAK clients purchased 3.4 million shares of OGDC from AKD clients during the month of March 2005.
While the similarity in these two figures might elicit curiosity, a closer look at the KSE data (for which AKD client codes where found to be fairly reliable) shows that 254 separate AKD clients bought OGDC shares from MAK and conversely 244 AKD clients sold OGDC shares to MAK.
Only 89 AKD clients both bought from and sold shares to MAK, leaving 409 AKD clients that could not have perpetrated any wash trades (unless perhaps through a complicated scheme of collusion). Of the 89 clients that did overlap, we reviewed details related to the largest one, client 1080 which is AKD's proprietary in-house trading account. We noted that client AKD No 1080 purchased 569,100 shares from at least seven different clients at MAK (note that the KSE data shows a blank MAK client code for 453,400 shares out of the 569,000). On the sale side, AKD No 1080 sold 455,100 shares to at least 13 clients (similarly, the KSE MAK data shows a blank MAK client code for 210,000 shares out the 455,100).)
Only one of the clients at MAK both bought from and sold shares to AKD No 1080 (1,000 shares purchased and 10,000 shares sold).
9 The implementation of Universal Identification Codes for clients in 2006 provided the SECP with statistics as to the number of accounts clients hold across different brokers. According to the data, 16% of investors, or 22,414 investors, maintained investment accounts at more than one broker. Sixty-eight investors held accounts at more than ten brokers.
10 The implementation of Universal Identification Codes for clients will alleviate this data limitation and greatly enhance the ability to track same client trades across different brokers.
C. WASH TRADE ANALYSIS OF FOUR LARGE BROKERS:
1. IDENTIFICATION OF POTENTIAL WASH TRADES:
As a result of the significant KSE data limitations discussed above, Diligence was unable to systematically analyze potential inter-broker wash trades. We did, however, review back-office trading data of four of the larger brokers to identify potential intra-broker wash trades within each of these brokers.11 Our analysis differed from that of the Taskforce, focusing on all scrips traded on the KSE12.
2. ANALYSIS OF POTENTIAL WASH TRADES:
We identified a number of instances, at all four brokers, in which the same underlying client appears to have been both the purchaser and seller on the same market trade. Part
II-Appendices A through D detail these potential wash trades, by scrip and by day.
TO ASSESS WHETHER THESE IDENTIFIED TRADES WERE TRULY WASH TRADES, WE ATTEMPTED TO ANSWER THE FOLLOWING TWO QUESTIONS:
-- 1) Were the trade volumes large enough to potentially impact scrip price?
-- 2) Were the trades followed by additional non-wash trades by the same -- -- -- investor through which he/she could have profited from a price increase?
In answer to question 1), we compared the value of each potential wash trade to that day's total trading activity for the same client and scrip, as well as total trading activity for that scrip on the entire KSE. We identified several instances for which the wash trade appeared to be material to total trading activity for the same scrip. In the majority of cases, however, the size of the wash trade represented only a very small fraction of that client's total trades for the day, and often less than one percent of the scrips' total KSE market activity.
THE FOLLOWING EXAMPLES RELATE TO TWO OF THE BROKERS REVIEWED:
-- For one broker, we identified 63 trades for which the buyer and seller were the same. Of those 63 trades, only 5 trades were large enough to represent more than 3% of total market trading activity for that scrip on that day.
-- For another broker, we identified 37 trades for which the buyer and seller were the same. Of those 37 trades, only one trade, of a very thinly-traded scrip, accounted for more than 3% of total market turnover.
-- (11 We reviewed four of the larger brokers engaging in potential wash trades based solely on KSE transaction data.)
-- (12 The Taskforce's analysis examined potential wash trades on just the heaviest traded scrips within the KSE100. Diligence's analysis focuses on all scrips traded on the KSE by the broker under review.)
-- In answer to question 2, we analyzed the subsequent trading activity of each client
-- involved in a potential wash trade. This review was designed to identify instances where
--a client transacting a wash trade may have benefited from a price increase through a sale transaction subsequent to the wash trade. We identified several such March cases which may have resulted in illicit gain, two examples of which we include below.13 We have referred all potential material cases of wash trading to the SECP for action as per law.
-- An institutional client at a large broker engaged in significant wash trades of the same scrip for three consecutive days. One particular day saw a total of 15 wash trades, spread over 4 trading hours. Between and around those various wash trades, the institutional client also engaged in significant sales of the same scrip to other market participants. Throughout the course of these 4 trading hours, the scrip's trading price increased from Rs. 81.8 to close at Rs. 89.
-- A large broker entered into 9 significant wash trades during one day of a typically thinly-traded scrip. These trades were placed through the broker's own proprietary trading account. In addition to these wash trades, the broker entered into sale transactions of over 1.6 million shares of the same scrip on the same day. The scrip's share price increased from Rs. 31 to Rs. 33 during this trading day.
In summary, we did not find sufficient evidence to conclude that pervasive wash trade abuses, whether alone or in combination with other potential abuses, were perpetrated within the context of a conspiracy to hype and manipulate the market during March 2005, as put forth by the Taskforce.
Diligence also does not believe that the methodologies used by the Taskforce in reviewing this wash trade area were sound or fact based, and we respectfully disagree with the resulting Taskforce Report's conclusions and suggestions on wash trades. There may have been isolated cases where violations of Section 17(a) occurred, and Diligence has referred all potential material cases of wash trading to the SECP for action as per law.
(13 To preserve the process integrity of the SECP's possible enforcement of these cases, we have not included information as to the identity of the brokers and clients involved in these cases.)
PART - III
FUTURES CONTRACTS
I. BACKGROUND AND SCOPE:
In its report, the Taskforce alleged that some brokers, in the weeks preceding the market's decline, executed a large amount of sales of March 2005 Futures contracts that resulted in having net sale positions in excess of same scrip shares held at CDC or recently purchased in the Ready Market. Such activity, referred to in Western markets as "naked short sales", results in illegal profits for manipulative investors who reap the difference between the contractually agreed upon future sale price and the lower price paid for shares purchased at or near delivery date.
Net sale positions of this type in excess of Rs 50 million are in violation of the Regulations Governing Futures Contracts of the Karachi Stock Exchange (Guarantee) Limited, Clause 3(b) and possibly Section 17(a) of the Securities and Exchange Ordinance, 1969.
The Taskforce further alleged that the brokers obtaining the large naked short sale positions in Futures contracts were the same brokers responsible for the market's steep decline by way of their intentional reduction of regulated COT lending. The Taskforce inferred that the motive for the broker's manipulative actions was to sell in Futures at very high prices as the market was rising, then to purchase the shares later in the Ready Market at discounted prices to effectuate delivery at settlement.
FROM THE TASKFORCE REPORT:
1) "The Sellers in the March Futures contract were of two types: (i) those that were holding shares that they had sold in the futures and locked in their arbitrage profits...(ii) the other sellers of the March contract, in clear violation of KSE rules
(although not easily enforceable due to group accounts), may not have held the shares that they had sold in the future, but had planned to buy these after the market fell. The latter category of sellers could have played a role in bringing prices down in the ready market by pulling out Badla financing."1 (emphasis added)
2) "It is possible that the Badla providers who were reducing their lending in specific scrips after March 08, had been selling actively in the ready market and were holding sell positions (i.e., selling) in the March futures contract in the same scrips..."2
3) "This environment [reduction of Badla] made it possible for investors to buy these stocks cheaply compared to their prices in the first week of March. This could have enabled investors who had sold these two scrips in the future to pick up stocks at much lower prices [from the Ready Market] thereby making large capital gains. The holding back of Badla by financiers who had earlier sold in the future market at a high price suggests that these brokers could have been involved in such a manipulation."3
The Taskforce called for these apparent abuses to be further investigated by the SECP. As described in detail below, Diligence undertook several steps in response to the -- (1 Taskforce Report, para 39.) (2 Ibid., para 33.)
TASKFORCE'S REQUEST TO EXAMINE THE TRADING ACTIVITIES OF BROKERS SELLING IN THE FUTURES MARKET, NAMELY:
1) Identifying any instances of brokers in net sales positions in excess of the Rs 50 million threshold of Clause 3(b) in March 2005 Futures contracts, thus triggering a need for the broker to satisfy the KSE that the shares sold were indeed held or recently purchased by the broker as directed in Clause 3(b).
2) For the brokers holding the largest net sales positions in March 2005 Futures contracts, comparing the broker's net sales positions to the shares reported held by the broker in its accounts at CDC. A short-fall in shares held of greater than Rs 50 million might be found to be a potential violation of Clause 3(b) and Section 17(a).
3) Quantifying and examining the lending of New COT for COT-eligible scrips by the market's more influential brokers for the period March 1 to March 18, 2005, to determine whether New COT for those scrips was reduced by these brokers, which could be a potential violation of Section 17(a).
Based on our analysis, we found numerous incidents in which brokers, subject to additional factual and legal analysis, may be in significant violation of the securities regulations. We are not, however, of the opinion that the potential violations were an intentional and integral part of a larger scheme to inflate, and then crash the market, as alleged by the Taskforce and others. Rather, these potential violations, if substantiated, are more likely to be individual isolated instances designed to take advantage of and to abuse regulatory loopholes and lack of oversight in order to profit from, at that time, overly optimistic sentiments in a highly volatile market.
-- (3 Ibid., para 55.)
II. FINDINGS
A. IDENTIFICATION OF BROKERS WITH NET SALES POSITIONS OVER CLAUSE 3(B) THRESHOLD
CLAUSE 3(B) SEEKS TO LIMIT THE RISK OF NAKED SHORT SELLING IN THE PAKISTANI MARKETS BY BROKERS.4 THE REGULATION STATES:
"No member shall have a sale position in a particular scrip of more than Rs 50 million, unless the actual shares sold over and above the aforesaid limit are deposited with the exchange or the broker gives documentary evidence that the shares are lying in CDC or with some bank or DFI, to the satisfaction of the KSE management. For the purposes of establishing such sale position, net buy position in T+3 shall be net off from net sale position in Futures Counter."
Based on our interpretation of the statute, brokers with aggregate net sales positions (on a broker rather than individual client level) in a particular scrip in excess of Rs 50 million are required to either: (1) deposit with the KSE the shares exceeding the Rs 50 million threshold, or (2) provide the KSE documentary evidence that the shares are recorded at CDC.5
Using detailed KSE data of trading activities in the Futures and Ready Market, our examination identified, for March 2005 futures contracts, all instances in which a broker trading a particular scrip appeared to have exceeded the Rs 50 million threshold. To calculate the broker's net sale position in a particular scrip, we aggregated the share value of the broker's cumulative net sale position on a daily basis in March 2005 futures contracts.6
(4 It is important to note that Clause 3(b) is ambiguous in terms of whether it is intended to apply at the broker or the client level. We believe that its plain meaning supports application at the broker level, for a particular scrip, but note that the clause's precise interpretation has not yet been tested in Pakistani courts.)
(5 We understand from SECP that the CDC is the only allowable depository in which to register ownership of shares is the CDC, in spite of the language in Clause 3(b) pertaining to the deposit of shares at institutions other than CDC.)
(6 Cumulative balances of net open futures positions were calculated based on actual daily trading values of the scrips on the day purchased. For the purposes of this calculation, shares held were not revalued on a daily basis based on new price movements. Also, for purposes of this analysis, net buy positions in T+3 were not netted from the cumulative net futures position as is provided for in Clause 3(b). In most cases, we found the broker's net T+3 position immaterial to the analysis and to the identification of potential violators of Clause 3(b). Nonetheless, consideration of a broker's net T+3 position, if any, may impact the precise quantification of the potential violation.)
We identified a total of 2,491 instances of brokers whose open net sales positions in March 2005 Futures contracts for a particular scrip, on a particular day, exceeded the Rs 50 million threshold of Clause 3(b).7 These 2,491 cases were spread out between 88 brokers and across 24 futures-eligible scrips.
Consistent with Clause 3(b), these brokers were required, at the time their positions exceeded the Rs 50 million threshold, to deposit with the KSE the shares representing the excess amount over the threshold, or provide documentation to KSE that the shares were recorded at CDC. Accordingly, and for purposes of our follow-on analysis of potential Clause 3(b) violations, we have provided our list of brokers to the SECP for further action as per law.
B. EXAMINATION OF NET SALES POSITIONS OF LARGER VOLUME BROKERS FOR VIOLATIONS OF CLAUSE 3(B) AND SECTION 17(A)
Section 17(a) of the Securities and Exchange Ordinance (1969) prohibits the use of any scheme, act or practice calculated to act as a fraud upon the market. The participation in naked short sales to a significant degree may be construed as a violation of Section 17(a):
"Prohibition of fraudulent acts, etc-- No person shall, for the purpose of inducing, dissuading, effecting, preventing, or in any manner influencing or turning to his advantage, the sale or purchase of any security, directly or indirectly, -
(a) employ any device, scheme, artifice, or engage in any act, practice or course of business which operates or is intended or calculated to operate as a fraud or deceit upon any person"
We examined further the net open sales positions in March 2005 Futures contracts of the thirteen brokers with the largest net sales positions across multiple scrips. In order to conduct this analysis, we collected account information from CDC detailing the quantities of shares held by each of the brokers for each of the scrips traded.
On a broker level basis for each individual trading day of March 2005 Futures contracts, we compared the open net position of each of the thirteen brokers by scrip to the aggregate balance of same scrip shares recorded in the broker's accounts at CDC.8
The results of this analysis for each of the thirteen brokers analyzed is summarized in Chart.
7) An "instance", for purposes of this analysis, represents each day a broker exceeds the threshold for a particular scrip. This definition may not necessarily represent the same number of separate actionable events as may be defined under the securities regulations.
For the purposes of this calculation, shares were not revalued on a daily basis based on daily closing share price. Revaluing futures positions on a daily basis based on closing share price may impact the amounts calculated.)
8) Under regulations in force at March 2005, brokers were allowed to open and maintain shares in several accounts at CDC: main account, house account, group account and client accounts. For this analysis, the share amounts in all of the brokers various accounts were aggregated together. As of April 1, 2005 the SECP moved to prohibit the use of group accounts at CDC. Letter from SECP to Central Depository.
III-1 below, and is also provided in Part III-Appendix A. These results support the inferences raised by the Taskforce in relation to these activities.
Chart III-1: Sample of Thirteen Brokers With Net Futures Sales Positions Greater
THAN VALUE OF SAME SCRIP SHARES HELD AT CDC9
===============================================================================================================

                                                 As Marked With an X

Broker                                                         Scrip

         BOP     DGKC    FABL   FFBL    FFC   ICI   NBP      NML  OGDC    PGF    POL    PPL    PSO    PTC  SNGP

===============================================================================================================

AAA                                                          X      X                    X                    X

BBB                                                   X             X             X                    X

CCC                                                                        X             X             X

DDD                              X      X       X     X      X      X             X      X      X      X      X

EEE               X                                   X             X      X      X                    X      X

FFF               X              X                                                       X      X      X

GGG                                                                                      X      X      X

HHH       X                                                         X                           X      X

III                                                   X             X                           X      X

JJJ                                                                               X      X      X      X

KKK                                                   X      X                           X      X

LLL       X       X              X                           X      X             X                    X      X

MMM       X               X                           X                    X      X      X             X

===============================================================================================================
We found that each one of the thirteen brokers, for at least one trading day within one scrip, had net futures sales balances of Rs 50 million greater than the value of their respective holdings at CDC. Most noteworthy are those brokers whose apparent shortfall in shares at CDC amounted to hundreds of millions of rupees and was prolific across several scrips for an extended period of time. If substantiated, these trading positions could be significant violations of Clause 3(b) and Section 17(a).
FOR EXAMPLE:10
-- By March 15, 2005, 'Broker DDD's' net sales positions in March 2005 futures for seven scrips were in excess, in material amounts, of its share holdings at CDC.
The broker's net sales position in PSO March futures, for example, was slightly over Rs 1 billion more than the aggregate share value of PSO scrip recorded in the broker's accounts at CDC. The broker's net sales position in PTC March futures, for example, was Rs 551 million more than the aggregate share value of PTC scrip recorded in the broker accounts at CDC.
-- Beginning in the four trading days prior to and including March 15, 2005, 'Broker BBB' accumulated net sales in PTC futures of Rs. 750 million in excess of the broker's holdings of the scrip as recorded in its accounts at CDC.
Company of Pakistan Limited. "Prohibition on Use of Group Account By CDS Participants." No. 1(6)cdc/pol/1997, 6 January 2005.
(9 The names of the brokers are being withheld to preserve the integrity of the on-going investigation into potential misconduct.)
(10 See schedules of detailed analysis for each of the thirteen brokers in Part III-Appendix A)
9 'Broker MMM', as of March 15, 2005, had net sales positions for seven scrips in excess of the broker's share holdings at CDC.
Noteworthy is that on March 16, 2005, the total number of shares held in the broker's accounts at CDC (the vast majority was in its group account) dropped from 4.8 million to just 175,000. Yet its cumulative net sales position in FABL futures remained at or near 5 million shares until the end of the trading month.11
We have referred to the SECP for further action as per law all instances for which the broker's net sales position exceeded its share amounts recorded at CDC. We note that in performing this analysis, we encountered several limitations in the use of CDC data as the basis for prima facie evidence of violations of either Clause 3(b) or Section 17(a).
Use of CDC data is hampered by a number of limitations including: (1) CDC is a national depository and shares held at CDC may be trading on an exchange other than KSE; (2) a broker in a net futures trading position appearing to be in excess of shares held at CDC may have the shares in another member's account at CDC, in which case there may be no violation of Clause 3(b); (3) there are short timing delays between trade date and settlement date that may impact the precise date at which the violation occurred, as well as the precise quantification of the amount; and (4) shares at CDC that are pledged or recently sold may not be so identified as unavailable for consideration in the share threshold analysis element of Clause 3(b).
C. NEW COT ACTIVITY OF LARGER BROKERS APPEARING TO BE OVER CLAUSE 3(B) THRESHOLD:
The Taskforce alleged that the brokers obtaining large naked short sale positions in Futures contracts were some of the same brokers responsible for the market's steep decline, as a direct result of their reduction of lending in the regulated COT market. Such activities could be violations of Section 17(a), and as such, the Taskforce called for a further forensic investigation into these allegations.12
In our examination of these allegations, we analyzed the amount of New COT provided to the market during the first two weeks of March 2005 by the same thirteen brokers identified in Section B above.13 Chart III-2 below shows that the New COT provided by these brokers remained relatively stable through March 15 or, in some cases, actually increased. Consistent with our findings in Part I of this Report, we find no evidence to support the Taskforce's allegations that brokers influential to the market and trading in significant naked short sale positions purposefully restricted COT lending to profit from their sales positions.
(11 Interestingly, per a review of the KSE trading records, this broker transacted no sales in FABL in the Ready market on the KSE between the trading days of March 14 to March 17, inclusive.
It is unclear to us why the broker's CDC-registered shares would have decreased drastically, other than the possibility that the broker may have transacted significant sales of the scrip on another stock exchange, or sold them "off- market" to another broker or client. This example highlights certain caveats and qualifications noted elsewhere in the Report concerning data availability and scope of work.)
(12 Taskforce Report, paras: 33, 39 and 55 (as quoted at beginning of Part III).)
Chart III-2 - Daily Purchases of New COT for Sample of Thirteen Brokers For the Period March 1 to March 15, 2006.
(13 As presented in Part I of this Report, New COT represents the value (in Rupees) of newly initiated carry over transactions transacted on the KSE on a given trading day. New COT is equivalent to "Open Market COT" provided on the KSE Daily Unreleased/Open Market COT reports.)
PART I - APPENDICES WITHDRAWAL OF REGULATED COT
===================================================================================

Phased-Out w.e.f.        Scrip No                  Symbol

October 8, 2004              1    SEPCO            Southern Electric Power Company

                                                   Ltd.

October 22, 2004             2    BSBF             BSJS Balanced Fund

November 5, 2004             3    PICB             PICIC Commercial Bank

November 19, 2004            4    TELE             Telecard Ltd.

December 3, 2004             5    FABL             Faysal Bank

December 17, 2004            6    UNBL             Union Bank

December 31, 2004            7    ENGRO            Engro Chemical

January 7, 2005              8    WCCL             World Communications Ltd.

January 14, 2005             9    DSFL             Dewan Salman Fiber Ltd.

January 21, 2005            10    PGF              PICIC Growth Fund

January 28, 2005            11    FFC              Fauji Fertilizer

February 4, 2005            12    PICIC            Pakistan Industrial Credit &

                                                   Investment Corp.

February 11, 2005           13    SSGC             Sui Southern Gas Co.

February 18, 2005           14    NML              Nishat Mills Ltd.

February 25, 2005           15    LUCK             Lucky Cement

March 4, 2005               16    SNGP             Sui Northern Gas Pipelines Ltd.

March 11, 2005              17    ACBL             Askari Commercial Bank

March 18, 2005              18    MCB              Muslim Commercial Bank Ltd.

March 25, 2005              19    MLCF             Maple Leaf Cement

April 1, 2005               20    ICI              ICI Pakistan

April 8, 2005               21    FFBL             Fauji Fertilizer Bin Qasim

April 15, 2005              22    BOP              Bank of Punjab

April 22, 2005              23    PTC              Pakistan Telecommunication

                                                   Company Ltd.

April 29, 2005              24    HUBCO            Hub Power Co.

May 6, 2005                 25    NBP              National Bank of Pakistan Ltd.

May 13, 2005                26    POL              Pakistan Oil Fields Ltd.

May 20, 2005                27    DGKC             D.G. Khan Cement Company Ltd.

May 27, 2005                28    OGDC             Oil and Gas Development Corp.

June 3, 2005                29    PSO              Pakistan State Oil

===================================================================================
APPENDIX B - TRENDS IN THE TRADING DATA FOR READY AND COT MARKETS, KARACHI STOCK EXCHANGE:
The Charts presented below represent key trading data and statistics from the KSE for periods preceding the March 2005 events.
-- Chart B-1 - Percent of Daily Values of New COT to Daily Values of Total COT, KSE, For the Period January 3, 2005 to March 15, 2005
APPENDIX B - TRENDS IN THE TRADING DATA FOR READY AND COT MARKETS, KARACHI STOCK EXCHANGE (CON'T)
COT regulations in force during 2004 and 2005 permitted investors holding COT-eligible scrips to leverage those scrips in the COT market in exchange for cash, without actually conducting a transaction on the Ready Market1. This method of raising cash differs from the typical COT financing mechanism discussed elsewhere in this Report, in which an investor used the availability of COT to borrow funds in order to temporarily finance shares he/she had just purchased on the Ready Market.
As demonstrated in Chart B-2 below, the value of New COT typically (and in some cases, markedly) exceeded the value of Ready Market trades on a daily basis for the six month period between July and December 2004. In the absence of any other plausible explanation, it would appear that many investors were indeed leveraging shares that they already owned above and beyond what was being purchased daily in the Ready Market.
-- Chart B-2 - Daily Trading Values for Ready Market and New COT, KSE, In Rupees Billions, For the Period July 1, 2004 to March 15, 2005
-- (1 Discussions with SECP staff provided the basis for this statement. Diligence did not independently review the applicable regulations.)
APPENDIX B - TRENDS IN THE TRADING DATA FOR READY AND COT MARKETS, KARACHI STOCK EXCHANGE (CON'T)
-- Chart B-3 - New COT by Brokers Representing COT Lenders, KSE, In Rupees Billions, For the Period January 3, 2005 to March 15, 2005
APPENDIX B - TRENDS IN THE TRADING DATA FOR READY AND COT MARKETS, KARACHI STOCK EXCHANGE (CON'T)
-- Chart B-4 - New COT by Brokers Representing COT Borrowers, KSE, In Rupees Billions, For the Period January 3, 2005 to March 15, 2005
APPENDIX C - LISTS OF BROKERS PARTICIPATING IN COT OPEN MARKET, KARACHI STOCK EXCHANGE
-- Table C-1 - Daily Transactions of New COT of Brokers Representing COT Lenders (Purchase Transactions), For the Period January 3 to March 15, 2005
==================================================================================================
Traded Value (in % of Cumulative
Broker Name Rupees) total %
==================================================================================================
Aqeel Karim Dhedhi Securities (Pvt.) Ltd 155,999,610,853 14.35% 14.35%
Arif Habib Limited 151,999,873,872 13.98% 28.33%
Atlas Capital Markets (Pvt.) Ltd. 76,654,870,388 7.05% 35.38%
KASB Securities Ltd. 67,849,093,332 6.24% 41.62%
Orix Investment Bank (Pak) Ltd. 51,808,542,777 4.77% 46.39%
Akberally Cassim & Sons 49,812,885,151 4.58% 50.97%
First CapitaL Equities Ltd. 43,023,078,851 3.96% 54.93%
Darson Securities (Pvt.) Ltd. 35,843,278,553 3.30% 58.22%
DJM Securities (Pvt.) Ltd. 35,482,319,978 3.26% 61.49%
Standard Capital Securities (Pvt.) Ltd. 32,148,257,691 2.96% 64.44%
Jahangir Siddiqui Cap. Markets 26,529,163,203 2.44% 66.88%
Invest Capital and Securities (Pvt) Ltd. 21,152,926,383 1.95% 68.83%
Elixir Securities Pak. (Pvt.) Ltd. 20,537,995,259 1.89% 70.72%
Escorts Investment Bank Ltd. 20,290,117,464 1.87% 72.59%
BMA Capital Management Limited 18,181,436,841 1.67% 74.26%
First Equity Modaraba 16,927,631,037 1.56% 75.82%
Security Investment Bank Ltd. 16,649,447,864 1.53% 77.35%
Multiline Securities (Pvt.) Ltd. 16,366,883,918 1.51% 78.85%
Motiwala Securities (Pvt.) Ltd. 14,202,481,185 1.31% 80.16%
Taurus Securities Limited 13,879,981,466 1.28% 81.44%
Global Securities ( Pakistan ) Ltd. 13,048,361,791 1.20% 82.64%
Live Securities (Private) Ltd. 12,777,515,485 1.18% 83.81%
Capital One Equities Limited. 11,409,045,950 1.05% 84.86%
Aziz Fidahusein & Co. (Private) Ltd. 10,727,998,360 0.99% 85.85%
Noman Abid & Company Ltd. 10,122,753,452 0.93% 86.78%
Prudential Securities Limited 9,523,131,437 0.88% 87.65%
FDM Capital Securities (Pvt.)Ltd 9,291,597,008 0.85% 88.51%
Intermarket Securities (Pvt.) Ltd. 8,297,089,153 0.76% 89.27%
Mohammed Hussain Adhi 7,847,869,662 0.72% 89.99%
First National Equities Ltd. 7,180,519,874 0.66% 90.65%
Ali Husain Rajabali Limited 6,674,810,202 0.61% 91.27%
Alfalah Securities (Pvt.) Ltd. 6,246,504,625 0.57% 91.84%
Adam Securities (Pvt.) Ltd. 5,563,467,441 0.51% 92.35%
Time Securities (Pvt.) Ltd. 4,775,946,784 0.44% 92.79%
Tewfiq Mohammed Amin Fikree 4,495,868,019 0.41% 93.21%
We Financial Services Ltd. 4,456,364,189 0.41% 93.62%
Moosani Securities (Pvt.) Ltd. 4,276,861,066 0.39% 94.01%
Aba Ali Habib 4,175,699,533 0.38% 94.40%
Invisor Securities (Private) Ltd. 3,871,487,388 0.36% 94.75%
Ismail Iqbal Securities (Pvt.) Ltd. 3,784,586,917 0.35% 95.10%
Ali Hassnain Yousuf Ali 3,450,856,510 0.32% 95.42%
Mohammed Saad Maniar 3,349,035,952 0.31% 95.72%
Sherman Securities (Pvt.) Ltd. 3,331,720,710 0.31% 96.03%
AMZ Securities (Pvt) Limited 3,295,244,941 0.30% 96.33%
Asian Securities Limited 3,163,763,454 0.29% 96.63%
Concordia Securities (Pvt) Ltd. 2,804,816,040 0.26% 96.88%
Kausar Abbas Bhayani 2,204,490,946 0.20% 97.09%
AMPLE Securities (Pvt.) Ltd. 2,186,032,765 0.20% 97.29%
Fortune Securities Limited 2,073,066,731 0.19% 97.48%
Amin Tai Securities (Pvt.) Ltd. 1,984,621,318 0.18% 97.66%
I. I. Kodvavi Securities ( Private ) Ltd 1,909,611,573 0.18% 97.84%
Ismail Abdul Shakoor 1,754,538,137 0.16% 98.00%
Dalal Securities (Pvt.) Ltd. 1,560,438,833 0.14% 98.14%
HH Misbah Securities (Pvt.) Ltd. 1,547,416,113 0.14% 98.28%
Siddik Moti 1,531,510,477 0.14% 98.42%
Mohammed Junaid Memon 1,462,954,147 0.13% 98.56%
Pak Meezan Securities (Pvt.)Ltd 1,270,204,977 0.12% 98.68%
H. M. Idrees H. Adam 1,237,729,199 0.11% 98.79%
Fawad Yusuf Securities (Private) Ltd. 1,194,020,819 0.11% 98.90%
Saao Capital (Private) Ltd. 1,070,573,563 0.10% 99.00%
B & B Securities (Pvt.) Ltd. 909,306,041 0.08% 99.08%
Dawood Mohammed 899,815,501 0.08% 99.16%
ACE Securities ( Private ) Ltd. 702,620,119 0.06% 99.23%
Abbasi Securities (SMC-PVT) Ltd 671,530,858 0.06% 99.29%
Akhai Securities (Pvt.) Ltd. 621,706,261 0.06% 99.35%
Bilquis Saleem Ghazipura 601,616,193 0.06% 99.40%
Prime Securities (Pvt.) Ltd. 578,224,250 0.05% 99.46%
Abdul Jabbar Khanani 567,834,751 0.05% 99.51%
Khatoon Hajiani 561,040,201 0.05% 99.56%
Cliktrade Limited 471,501,319 0.04% 99.60%
Eastern Capital Ltd. 406,062,403 0.04% 99.64%
Altaf Adam 338,324,836 0.03% 99.67%
Mohammed Farooq H. Abdullah 308,297,877 0.03% 99.70%
Abdul Kadir Yusuf 307,698,712 0.03% 99.73%
Friendly Securities ( Private ) Ltd. 283,119,763 0.03% 99.75%
A.H.K.D. Securities (Pvt) Ltd. 273,537,759 0.03% 99.78%
Mohammed Siddique Suleman 205,126,656 0.02% 99.80%
Mohammed Tariq Moti 182,490,410 0.02% 99.82%
Zillion Capital Securi. (Pvt.) Ltd 170,093,967 0.02% 99.83%
Salman Services (Pvt) Limited 135,097,888 0.01% 99.84%
Munaf Sattar Securities (Private) Ltd. 134,596,230 0.01% 99.86%
Muhammad Shahid Durvesh 105,068,013 0.01% 99.87%
Shahid Ali Habib Securities (Pvt.) Ltd. 103,327,077 0.01% 99.88%
Zafar Moti Capital Sec. (Pvt.)Ltd 101,569,296 0.01% 99.88%
Amin Siddiq Parekh Sec.(Pvt.)Lt 90,697,895 0.01% 99.89%
M. Munir Khanani Securities (Pvt.) Ltd. 86,263,966 0.01% 99.90%
Malik Khan Awan 78,103,023 0.01% 99.91%
Moosa Noor Mohammed Shahzada & Co. 77,561,398 0.01% 99.91%
KAI Securities (Private) Ltd. 74,238,324 0.01% 99.92%
Abdul Majeed Zakaria 56,168,045 0.01% 99.93%
Mohammed Anaf Kapadia 53,978,204 0.00% 99.93%
Mohammed Anas Kapadia 52,342,975 0.00% 99.94%
Muhammad Hussain A. Karim 50,616,010 0.00% 99.94%
Al-Asar Securities (Pvt.) Ltd. 50,063,626 0.00% 99.95%
Alfa Adhi Securities ( Pvt.) Ltd. 48,430,555 0.00% 99.95%
A. Sattar Motiwala Sec.(Pvt.) Ltd 48,269,096 0.00% 99.95%
A. Latif Noorani 44,920,800 0.00% 99.96%
Javed Omer Vohra & Company Ltd. 41,705,180 0.00% 99.96%
Worldwide Securities (Pvt.) Ltd. 40,563,909 0.00% 99.97%
Oriental Securities (Private) Ltd 37,806,738 0.00% 99.97%
MARS Securities (Pvt.) Ltd. 36,944,841 0.00% 99.97%
Yacoob Habib 36,061,372 0.00% 99.98%
Haji Ghani Haji Usman 35,713,530 0.00% 99.98%
Mohammed Ayub Younus Adhi 30,769,205 0.00% 99.98%
Mohammed Ashfaq Hussain 29,564,623 0.00% 99.99%
A. Sattar Dawood Adhi 28,099,748 0.00% 99.99%
AAG Securities (Private) Ltd. 26,904,336 0.00% 99.99%
Haroon Suleman 17,317,517 0.00% 99.99%
M. Nisar M. Usman Ashrafi 15,862,307 0.00% 99.99%
A.R. Securities (Pvt.) Ltd. 13,489,750 0.00% 100.00%
Muhammad Nadeem Abdul Ghaffar 9,643,252 0.00% 100.00%
Finex Securities Limited 9,234,638 0.00% 100.00%
Bawa Securities ( Pvt. ) Ltd. 7,946,680 0.00% 100.00%
MAC Securities (Private) Ltd. 6,287,090 0.00% 100.00%
Marfani Securities (Pvt.) Ltd. 5,313,671 0.00% 100.00%
Continental Capital Management (Pvt) Ltd 5,180,019 0.00% 100.00%
M.R.A Securities ( Pvt ) Ltd. 4,635,625 0.00% 100.00%
Mohammed Anis Ismail 1,411,250 0.00% 100.00%
Apex Capital Sec. (Pvt.) Ltd. 1,264,389 0.00% 100.00%
Aziz Moosa Khanani 998,035 0.00% 100.00%
Abdul Aziz Tayub Patel 970,209 0.00% 100.00%
Iqbal Usman Kodv. Sec. (Pvt.) Ltd 763,750 0.00% 100.00%
Salim M. Sozer 379,500 0.00% 100.00%
Al-Mal Securities & Services Ltd. 206,052 0.00% 100.00%
Tahir Shafique 105,100 0.00% 100.00%
TOTAL 1,087,166,404,217
==================================================================================================
TABLE C-2 - DAILY TRANSACTIONS OF NEW COT OF BROKERS REPRESENTING COT
Borrowers (Sell Transactions), For the Period January 3 to March 15, 2005
==================================================================================================
Traded Value (in % of Cumulative
Broker Name Rupees) total %
==================================================================================================
Aqeel Karim Dhedhi Securities (Pvt.) Ltd 169,579,911,117 15.60% 15.60%
Mohammed Hussain Adhi 56,064,138,222 5.16% 20.76%
Standard Capital Securities (Pvt.) Ltd. 39,318,916,154 3.62% 24.37%
KASB Securities Ltd. 38,427,031,707 3.53% 27.91%
First CapitaL Equities Ltd. 37,076,941,916 3.41% 31.32%
Darson Securities (Pvt.) Ltd. 33,830,704,243 3.11% 34.43%
First National Equities Ltd. 33,828,891,135 3.11% 37.54%
DJM Securities (Pvt.) Ltd. 32,156,307,754 2.96% 40.50%
Motiwala Securities (Pvt.) Ltd. 29,732,768,029 2.73% 43.23%
Abdul Jabbar Khanani 29,581,740,098 2.72% 45.95%
Arif Habib Limited 27,811,869,351 2.56% 48.51%
M. Munir Khanani Securities (Pvt.) Ltd. 19,911,742,114 1.83% 50.34%
Elixir Securities Pak. (Pvt.) Ltd. 18,731,357,480 1.72% 52.07%
Adam Securities (Pvt.) Ltd. 18,071,682,667 1.66% 53.73%
Mohammed Anas Kapadia 17,780,665,353 1.64% 55.36%
Multiline Securities (Pvt.) Ltd. 16,912,840,439 1.56% 56.92%
Live Securities (Private) Ltd. 16,399,671,480 1.51% 58.43%
Ismail Abdul Shakoor 15,208,589,513 1.40% 59.83%
SAZ Capital Securities (Pvt.)Ltd 14,885,744,597 1.37% 61.20%
Prudential Securities Limited 12,899,157,561 1.19% 62.38%
FDM Capital Securities (Pvt.)Ltd 11,799,841,418 1.09% 63.47%
Yacoob Habib 11,239,447,543 1.03% 64.50%
Intermarket Securities (Pvt.) Ltd. 11,150,859,822 1.03% 65.53%
Fortune Securities Limited 11,116,575,959 1.02% 66.55%
Friendly Securities ( Private ) Ltd. 10,984,697,198 1.01% 67.56%
A.R. Securities (Pvt.) Ltd. 10,847,918,280 1.00% 68.56%
Zillion Capital Securi. (Pvt.) Ltd 10,436,229,929 0.96% 69.52%
I. I. Kodvavi Securities ( Private ) Ltd 10,132,905,075 0.93% 70.45%
First Equity Modaraba 10,016,863,530 0.92% 71.37%
Muhammad Nadeem Abdul Ghaffar 9,846,763,419 0.91% 72.28%
Time Securities (Pvt.) Ltd. 9,092,099,540 0.84% 73.11%
Dalal Securities (Pvt.) Ltd. 8,815,793,992 0.81% 73.93%
Taurus Securities Limited 8,378,534,774 0.77% 74.70%
Mohammed Anaf Kapadia 7,550,514,387 0.69% 75.39%
Bawa Securities ( Pvt. ) Ltd. 7,515,833,287 0.69% 76.08%
A.H.K.D. Securities (Pvt) Ltd. 7,323,409,800 0.67% 76.76%
Aba Ali Habib 7,281,180,323 0.67% 77.43%
Sherman Securities (Pvt.) Ltd. 6,986,929,176 0.64% 78.07%
Muhammad Hussain A. Karim 6,491,215,222 0.60% 78.66%
Prime Securities (Pvt.) Ltd. 6,466,062,150 0.59% 79.26%
Munaf Sattar Securities (Private) Ltd. 6,314,174,235 0.58% 79.84%
KAI Securities (Private) Ltd. 6,309,486,770 0.58% 80.42%
Haji Ghani Haji Usman 5,753,894,293 0.53% 80.95%
AMPLE Securities (Pvt.) Ltd. 5,666,309,929 0.52% 81.47%
M. Nisar M. Usman Ashrafi 5,475,501,976 0.50% 81.97%
Moosa Noor Mohammed Shahzada & Co. 5,443,372,522 0.50% 82.48%
Muhammad Javed Surmawala 5,358,318,865 0.49% 82.97%
Azee Securities (Pvt.) Ltd. 5,334,000,570 0.49% 83.46%
Ismail Iqbal Securities (Pvt.) Ltd. 5,285,766,901 0.49% 83.95%
Bagasra Securities (Pvt.) Ltd. 5,220,538,549 0.48% 84.43%
ACE Securities ( Private ) Ltd. 5,196,738,449 0.48% 84.90%
Shahid Ali Habib Securities (Pvt.) Ltd. 5,092,846,699 0.47% 85.37%
Siddik Moti 5,016,516,038 0.46% 85.83%
MAC Securities (Private) Ltd. 4,877,072,393 0.45% 86.28%
M.R.A Securities ( Pvt ) Ltd. 4,443,975,167 0.41% 86.69%
Pak Meezan Securities (Pvt.)Ltd 4,428,418,666 0.41% 87.10%
HH Misbah Securities (Pvt.) Ltd. 4,369,732,566 0.40% 87.50%
Moosani Securities (Pvt.) Ltd. 4,318,932,737 0.40% 87.90%
Fawad Yusuf Securities (Private) Ltd. 4,115,833,784 0.38% 88.28%
Mohammed Ayub Younus Adhi 4,063,459,169 0.37% 88.65%
Eastern Capital Ltd. 3,991,196,588 0.37% 89.02%
Concordia Securities (Pvt) Ltd. 3,923,839,401 0.36% 89.38%
Kausar Abbas Bhayani 3,772,337,373 0.35% 89.72%
We Financial Services Ltd. 3,738,812,436 0.34% 90.07%
Khatoon Hajiani 3,734,461,996 0.34% 90.41%
Global Securities ( Pakistan ) Ltd. 3,723,274,116 0.34% 90.75%
Invest Capital and Securities (Pvt) Ltd. 3,563,547,108 0.33% 91.08%
Zafar Moti Capital Sec. (Pvt.)Ltd 3,537,399,699 0.33% 91.41%
Iqbal Usman Kodv. Sec. (Pvt.) Ltd 3,481,940,378 0.32% 91.73%
Aziz Fidahusein & Co. (Private) Ltd. 3,467,072,797 0.32% 92.05%
Continental Capital Management (Pvt) Ltd 3,308,552,896 0.30% 92.35%
Saao Capital (Private) Ltd. 3,243,264,093 0.30% 92.65%
Mohammed Siddique Suleman 3,170,173,622 0.29% 92.94%
Invisor Securities (Private) Ltd. 3,073,279,944 0.28% 93.22%
Escorts Investment Bank Ltd. 2,906,712,055 0.27% 93.49%
Al-Asar Securities (Pvt.) Ltd. 2,892,094,322 0.27% 93.76%
Orix Investment Bank (Pak) Ltd. 2,851,824,272 0.26% 94.02%
MARS Securities (Pvt.) Ltd. 2,750,332,524 0.25% 94.27%
Cliktrade Limited 2,662,620,509 0.24% 94.52%
Javed Omer Vohra & Company Ltd. 2,611,880,665 0.24% 94.76%
Haroon Suleman 2,609,339,539 0.24% 95.00%
Capital One Equities Limited. 2,516,101,373 0.23% 95.23%
B & B Securities (Pvt.) Ltd. 2,310,980,921 0.21% 95.44%
A. Latif Noorani 2,310,569,124 0.21% 95.65%
Worldwide Securities (Pvt.) Ltd. 2,232,006,732 0.21% 95.86%
Mohammed Anis Ismail 2,052,800,384 0.19% 96.05%
Ali Husain Rajabali Limited 1,971,106,123 0.18% 96.23%
Ashfaq Zakaria Ghory 1,965,222,746 0.18% 96.41%
A. Sattar Motiwala Sec.(Pvt.) Ltd 1,885,375,605 0.17% 96.58%
Salman Services (Pvt) Limited 1,813,922,874 0.17% 96.75%
AAG Securities (Private) Ltd. 1,812,041,967 0.17% 96.92%
Mohammed Ashfaq Hussain 1,678,443,685 0.15% 97.07%
AMZ Securities (Pvt) Limited 1,640,580,755 0.15% 97.22%
Muhammad Shahid Durvesh 1,611,860,921 0.15% 97.37%
Mohammed Tariq Moti 1,518,680,714 0.14% 97.51%
Mohammed Saad Maniar 1,488,464,363 0.14% 97.65%
Mohammed Farooq H. Abdullah 1,425,566,211 0.13% 97.78%
Alfa Adhi Securities ( Pvt.) Ltd. 1,356,306,906 0.12% 97.90%
Finex Securities Limited 1,316,288,367 0.12% 98.02%
Zohra w/o M. Siddiq Mayari 1,303,230,468 0.12% 98.14%
Bilquis Saleem Ghazipura 1,285,730,475 0.12% 98.26%
Ali Hassnain Yousuf Ali 1,283,365,480 0.12% 98.38%
Oriental Securities (Private) Ltd 1,228,658,689 0.11% 98.49%
Akberally Cassim & Sons 1,221,461,074 0.11% 98.61%
Malik Khan Awan 1,214,882,806 0.11% 98.72%
A. Sattar Dawood Adhi 1,036,625,745 0.10% 98.81%
Al-Mal Securities & Services Ltd. 1,008,071,041 0.09% 98.91%
Atlas Capital Markets (Pvt.) Ltd. 974,322,729 0.09% 99.00%
Lakhani Securities (Pvt.) Ltd. 972,659,128 0.09% 99.08%
Apex Capital Sec. (Pvt.) Ltd. 880,586,503 0.08% 99.17%
Marfani Securities (Pvt.) Ltd. 842,217,555 0.08% 99.24%
Mohammed Tariq Vohra 840,264,477 0.08% 99.32%
Amin Siddiq Parekh Sec.(Pvt.)Lt 795,968,970 0.07% 99.39%
Abdul Majeed Zakaria 790,430,039 0.07% 99.47%
BMA Capital Management Limited 754,108,006 0.07% 99.54%
Abdul Kadir Yusuf 584,856,617 0.05% 99.59%
Ghulam Mohammed Ismail 550,054,103 0.05% 99.64%
Mohammed Junaid Memon 485,634,172 0.04% 99.69%
Abdul Aziz Tayub Patel 485,477,940 0.04% 99.73%
Akhai Securities (Pvt.) Ltd. 473,378,930 0.04% 99.77%
Irfan Mazhar Securities (Pvt.)Ltd 472,942,750 0.04% 99.82%
Noman Abid & Company Ltd. 428,023,093 0.04% 99.86%
Altaf Adam 301,563,307 0.03% 99.88%
Aziz Moosa Khanani 254,822,729 0.02% 99.91%
H. M. Idrees H. Adam 185,970,583 0.02% 99.92%
Abbasi Securities (SMC-PVT) Ltd 176,624,082 0.02% 99.94%
Zaitoon M. A. Shakoor 174,172,304 0.02% 99.96%
Asian Securities Limited 108,190,643 0.01% 99.97%
Salim M. Sozer 86,401,218 0.01% 99.97%
Arif H. Yousuf Saya 85,467,256 0.01% 99.98%
Mohammed Hussain Ismail 55,700,100 0.01% 99.99%
Dawood Mohammed 51,524,195 0.00% 99.99%
Sakarwala Capital Sec.(Pvt.) Ltd 30,646,460 0.00% 100.00%
Memon Securities (Private) Ltd. 25,006,275 0.00% 100.00%
Alfalah Securities (Pvt.) Ltd. 19,969,840 0.00% 100.00%
Jahangir Siddiqui Cap. Markets 7,882,300 0.00% 100.00%
TOTAL 1,087,166,404,217
==================================================================================================
APPENDIX D - LIST OF SCRIPS COMPRISING GROUP A (I.E., SCRIPS PHASED-OUT OF COT AS OF MARCH 18, 2005)
===================================================================================

To Be Phased-Out         Scrip No    Symbol   Value  of                  Value Date

w.e.f.                                       Total COT

                                             (in millions)

===================================================================================

October 8, 2004             1        SEPCO        Rs. 20.4          August 31, 2004

October 22, 2004            2         BSBF        Rs .62.2          August 31, 2004

November 5, 2004            3         PICB        Rs. 88.0          August 31, 2004

November 19, 2004           4         TELE       Rs. 115.5          August 31, 2004

December 3, 2004            5         FABL       Rs. 129.7          August 31, 2004

December 17, 2004           6         UNBL       Rs. 165.6          August 31, 2004

December 31, 2004           7        ENGRO       Rs. 186.6          August 31, 2004

Subtotal                                         RS. 768.0

January 7, 2005             8         WCCL         Rs.25.3          January 3, 2005

January 14, 2005            9         DSFL       Rs. 304.8          January 3, 2005

January 21, 2005           10          PGF       Rs. 930.1          January 1, 2005

January 28, 2005           11          FFC       Rs. 635.0          January 3, 2005

February 4, 2005           12        PICIC       Rs. 909.0          January 3, 2005

February 11, 2005          13         SSGC       Rs. 601.7          January 3, 2005

February 18, 2005          14          NML     Rs. 1,462.4          January 3, 2005

Subtotal                                       Rs. 4,868.3

February 25, 2005          15         LUCK       Rs. 957.5        February 18, 2005

March 4, 2005              16         SNGP     Rs. 2,208.0        February 18, 2005

March 11, 2005             17         ACBL      Rs.  611.6        February 18, 2005

March 18, 2005             18          MCB     Rs. 1,388.8        February 18, 2005

      Subtotal                                 Rs. 5,165.9

===================================================================================
APPENDIX D - LIST OF POTENTIAL WASH SALES (IN SHARES)
JAHANGIR SIDDIQUI CAPITAL MARKETS:
================================================================================================================================

                                           Wash        Clien     % of Wash       Client    % of Wash                   % of Wash

 Client Code    Scrip          Date      Trades     Purchases       Trades        Sales       Trades     Total Market     Trades

================================================================================================================================

003630           FABL     01-Mar-05       1,000         6,000        16.7%       87,500         1.1%        6,312,000       0.0%

003630           PIOC     01-Mar-05       1,500         2,000        75.0%        2,000        75.0%          766,500       0.2%

002600           ZLFI     01-Mar-05       1,500         2,700        55.6%        5,700        26.3%           13,300      11.3%

003630           DGKC     02-Mar-05       1,000        60,000         1.7%        5,000        20.0%       22,861,800       0.0%

004038           OGDC     02-Mar-05       1,500       125,000         1.2%      125,000         1.2%      184,708,400       0.0%

003630            PGF     03-Mar-05       3,000        10,000        30.0%       22,000        13.6%        1,994,500       0.2%

003630            PPL     03-Mar-05       1,500         8,500        17.6%       13,000        11.5%        5,636,700       0.0%

004038            PTC     04-Mar-05       5,000        25,000        20.0%       30,000        16.7%      430,751,000       0.0%

003242          JSCML     04-Mar-05      11,000        11,000       100.0%       11,000       100.0%           35,000      31.4%

004038            NBP     04-Mar-05       1,000       115,000         0.9%      140,000         0.7%       57,762,200       0.0%

004038            PTC     07-Mar-05         500         2,500        20.0%        2,500        20.0%      290,249,500       0.0%

003630           DGKC     07-Mar-05      10,000        53,500        18.7%       78,500        12.7%       85,415,300       0.0%

002600            APL     07-Mar-05         500         1,600        31.3%        2,500        20.0%        1,674,000       0.0%

003333           CTTL     07-Mar-05      13,000       465,500         2.8%       25,000        52.0%        1,606,000       0.8%

000900        POL-MAR     08-Mar-05      25,000       418,500         6.0%       43,500        57.5%        9,431,500       0.3%

002969           FCCL     08-Mar-05   1,500,000     2,000,000        75.0%    2,453,500        61.1%       24,836,000       6.0%

004038            PTC     08-Mar-05       1,000        82,500         1.2%       82,500         1.2%      332,177,500       0.0%

002600            PPL     09-Mar-05       1,000         3,000        33.3%        4,000        25.0%        7,758,100       0.0%

002600            PSO     09-Mar-05       3,000        14,500        20.7%       14,000        21.4%       47,071,900       0.0%

003333           CTTL     09-Mar-05      25,500       879,500         2.9%       34,500        73.9%        2,125,500       1.2%

004038            PTC     09-Mar-05       2,000        82,500         2.4%       82,500         2.4%      332,177,500       0.0%

003333          PAKRI     10-Mar-05       5,000        41,700        12.0%        8,200        61.0%          107,200       4.7%

002745           ATRL     10-Mar-05       4,500        35,000        12.9%        5,000        90.0%          632,500       0.7%

004038            PTC     10-Mar-05       2,500         5,000        50.0%        2,500       100.0%      226,118,500       0.0%

003242           FCCL     10-Mar-05     175,000       675,000        25.9%    1,150,000        15.2%       14,381,000       1.2%

002600          ENGRO     11-Mar-05       3,600         5,100        70.6%       10,200        35.3%        2,016,100       0.2%

000588           JSIB     14-Mar-05         500        13,100         3.8%          600        83.3%          388,900       0.1%

003630           DGKC     14-Mar-05       6,000        76,000         7.9%      126,000         4.8%       45,631,700       0.0%

003862           SNGP     14-Mar-05      75,000       175,000        42.9%      275,000        27.3%       36,452,300       0.2%

004038            PTC     14-Mar-05       1,000        87,500         1.1%      159,000         0.6%       57,569,800       0.0%

003630           DGKC     15-Mar-05       1,000        97,500         1.0%       71,500         1.4%       72,848,500       0.0%

003088        NBP-MAR     17-Mar-05         500        75,500         0.7%          500       100.0%        9,458,500       0.0%

003630           JOVC     22-Mar-05         200           200       100.0%          200       100.0%            7,600       2.6%

003630           BOSI     22-Mar-05       1,000         1,000       100.0%        1,000       100.0%          728,500       0.1%

003630           JOVC     24-Mar-05         200           200       100.0%          500        40.0%            3,100       6.5%

================================================================================================================================
APPENDIX D - LIST OF POTENTIAL WASH SALES (IN SHARES)
JAHANGIR SIDDIQUI CAPITAL MARKETS:
========================================================================================================================

                                        Wash       Client    % of Wash      Client  % of Wash                  % of Wash

Client Code    Scrip          Date    Trades    Purchases       Trades       Sales     Trades    Total Market     Trades

========================================================================================================================

003630           PSO     25-Mar-05     2,000        2,000       100.0%       4,000      50.0%      11,237,800       0.0%

003630          FCCL     29-Mar-05     2,000       40,500         4.9%      27,500       7.3%      10,387,000       0.0%

003630          FCCL     30-Mar-05     5,000       51,000         9.8%      38,500      13.0%       9,477,500       0.1%

003630          PIOC     30-Mar-05     1,000       38,000         2.6%       8,000      12.5%       1,900,500       0.1%

003630          JSIB     31-Mar-05     1,000        3,000        33.3%       5,500      18.2%         661,900       0.2%

002600          JSIB     31-Mar-05     1,000        3,000        33.3%       2,000      50.0%         661,900       0.2%

002600          ZLFI     31-Mar-05       100          300        33.3%         100     100.0%             900      11.1%

========================================================================================================================
NOTE
1) Highlighted rows represent potential wash trades that account for over 3% of total market turnover for that day.
=============================================================================================================================================
BUYER SELLER
Name of Member BRY SLR CLIENT CLIENT TRADE QTY No Trades Scrip
=============================================================================================================================================
Atlas Investment Bank Limited 17 17 154 154 1,348,800 16 OGDC-REG
Worldwide Securities (Pvt.) Limited 196 196 5 5 1,335,000 35 OGDC-REG
Worldwide Securities (Pvt.) Limited 196 196 5 5 960,000 13 PTC-REG
Atlas Investment Bank Limited 17 17 154 154 500,000 6 PTC-REG
Worldwide Securities (Pvt.) Limited 196 196 A A 435,000 9 PTC-REG
Atlas Investment Bank Limited 17 17 154 154 400,000 3 NBP-REG
A.H.K.D. Securities (Pvt.) Limited 178 178 11 11 382,500 7 OGDC-REG
Worldwide Securities (Pvt.) Limited 196 196 5 5 346,300 27 PSO-REG
A.H.K.D. Securities (Pvt.) Limited 178 178 11 11 300,000 3 PTC-REG
KASB Securities Limited 128 128 013758 013758 250,000 4 OGDC-FWD
Taurus Securities Limited 129 129 SA SA 250,000 3 OGDC-REG
Worldwide Securities (Pvt.) Limited 196 196 A A 216,900 6 OGDC-REG
KASB Securities Limited 128 128 013600 013600 200,000 1 PTC-FWD
Arif Habib Securities Limited 50 50 0003 0003 200,000 2 POL-REG
Motiwala Securities (Pvt.) Ltd. 198 198 AFTAB AFTAB 175,000 4 OGDC-REG
Muhammad Nadeem A. Ghaffar 153 153 370 370 155,000 7 OGDC-FWD
Aqeel Karim Dhedhi Securities (Pvt.) Ltd. 19 19 1512 1512 145,000 6 POL-REG
Multiline Securities (Pvt.) Ltd. 49 49 01 01 129,500 4 OGDC-REG
Aqeel Karim Dhedhi Securities (Pvt.) Ltd. 19 19 1196 1196 128,000 1 PTC-REG
Muhammad Munir Muhammad Ahmed Khanani 84 84 801 801 114,500 2 PTC-FWD
Muhammad Munir Muhammad Ahmed Khanani 84 84 801 801 114,300 3 NBP-REG
M. S. Securities (Private) Limited 105 105 189 189 113,900 3 OGDC-REG
Sherman Securities (Pvt.) Ltd. 6 6 9226 9226 110,700 52 OGDC-REG
Arif Habib Securities Limited 50 50 0007 0007 100,000 1 OGDC-FWD
KASB Securities Limited 128 128 013600 013600 100,000 1 OGDC-FWD
Live Securities (Private) Limited 43 43 1044 1044 100,000 1 PTC-FWD
KASB Securities Limited 128 128 013600 013600 100,000 1 NBP-REG
Atlas Investment Bank Limited 17 17 003 003 100,000 1 OGDC-REG
Sherman Securities (Pvt.) Ltd. 6 6 0121 0121 100,000 1 OGDC-REG
DJM Securities (Pvt.) Limited 16 16 101 101 100,000 3 PSO-REG
KASB Securities Limited 128 128 012364 012364 96,300 2 OGDC-REG
Aba Ali Habib 162 162 16 16 96,000 12 NBP-FWD
MRA Securities (Private) Limited 194 194 01 01 95,000 1 PTC-REG
Ismail Abdul Shakoor 74 74 44 44 94,500 2 PTC-REG
Darson Securities (Private) Limited 90 90 1823 1823 94,000 1 OGDC-REG
Worldwide Securities (Pvt.) Limited 196 196 5 5 89,900 1 NBP-REG
Abdul Jabbar Khanani 134 134 B13 B13 85,000 1 OGDC-REG
Atlas Investment Bank Limited 17 17 154 154 75,000 2 POL-REG
Sherman Securities (Pvt.) Ltd. 6 6 9226 9226 67,500 9 OGDC-FWD
Sohail Raza Moosani 143 143 112 112 66,600 1 NBP-REG
Muhammad Anas Kapadia 68 68 AR14 AR14 66,500 1 PTC-FWD
Worldwide Securities (Pvt.) Limited 196 196 A A 61,000 9 PSO-FWD
Motiwala Securities (Pvt.) Ltd. 198 198 2202 2202 61,000 3 OGDC-REG
Aba Ali Habib 162 162 16 16 54,100 8 NBP-REG
DJM Securities (Pvt.) Limited 16 16 12 12 52,900 2 OGDC-REG
KASB Securities Limited 128 128 013758 013758 50,000 1 NBP-FWD
Sikandar Esmail Ahmed Bagasrawala 140 140 35 35 50,000 1 PTC-REG
Sohail Raza Moosani 143 143 109 109 49,500 2 PTC-FWD
M. S. Securities (Private) Limited 105 105 189 189 49,500 2 PTC-REG
Moosani Securities (Pvt) Limited 158 158 214 214 47,500 1 OGDC-FWD
Muhammad Nadeem A. Ghaffar 153 153 370 370 46,500 2 PTC-REG
Muhammad Nadeem A. Ghaffar 153 153 370 370 46,300 19 PSO-REG
Moosani Securities (Pvt) Limited 158 158 376 376 44,000 4 PTC-REG
Motiwala Securities (Pvt.) Ltd. 198 198 AFTAB AFTAB 43,500 3 OGDC-FWD
Sakarwala Capital Securities (Pvt.) Ltd. 10 10 IK IK 43,000 1 OGDC-FWD
Worldwide Securities (Pvt.) Limited 196 196 5 5 43,000 3 OGDC-FWD
KASB Securities Limited 128 128 013758 013758 42,800 1 NBP-REG
Moosani Securities (Pvt) Limited 158 158 114 114 41,400 1 OGDC-REG
Sikandar Esmail Ahmed Bagasrawala 140 140 35 35 40,500 1 PTC-FWD
Aqeel Karim Dhedhi Securities (Pvt.) Ltd. 19 19 1186 1186 38,000 1 OGDC-REG
Muhammad Nadeem A. Ghaffar 153 153 370 370 36,500 13 PSO-FWD
Prime Securities (Private) Limited 184 184 R R 36,500 1 OGDC-REG
Muhammad Munir Muhammad Ahmed Khanani 84 84 801 801 35,200 2 OGDC-REG
Ghulam Mohammed Ismail 131 131 G1 G1 35,000 1 PSO-FWD
Sherman Securities (Pvt.) Ltd. 6 6 9226 9226 33,000 26 PSO-FWD
Moosani Securities (Pvt) Limited 158 158 304 304 29,000 7 PTC-REG
Moosani Securities (Pvt) Limited 158 158 304 304 27,700 14 OGDC-REG
Al - Asar Securities (Private) Limited 34 34 SM1 SM1 26,500 2 NBP-REG
A. R. Securities (Private) Limited 75 75 454 454 26,000 2 PTC-REG
Salim M. Sozer 121 121 CO CO 25,200 2 NBP-REG
Aba Ali Habib 162 162 16 16 25,000 3 OGDC-FWD
Abdul Jabbar Khanani 134 134 H45 H45 25,000 1 OGDC-FWD
ACE Securities (Private) Limited 67 67 2 2 25,000 1 OGDC-FWD
First Captial Equities Limited 57 57 110520 110520 25,000 1 OGDC-FWD
S. C. Securities (Private) Limited 112 112 772 772 25,000 1 OGDC-FWD
Time Securities (Private) Limited 36 36 07002 07002 25,000 1 OGDC-FWD
Jahangir Siddiqui Capital Markets Limited 149 149 900 900 25,000 1 POL-FWD
Fortune Securities Limited 46 46 14E 14E 25,000 1 PTC-FWD
Yousuf Ibrahim 89 89 J15 J15 25,000 1 PTC-FWD
Aqeel Karim Dhedhi Securities (Pvt.) Ltd. 19 19 1512 1512 25,000 1 OGDC-REG
KASB Securities Limited 128 128 013600 013600 25,000 1 OGDC-REG
Sohail Raza Moosani 143 143 112 112 24,000 2 PTC-FWD
Atlas Investment Bank Limited 17 17 201 201 24,000 1 OGDC-REG
Escorts Investment Bank Limited 138 138 018 018 22,500 2 OGDC-FWD
Moosani Securities (Pvt) Limited 158 158 351 351 22,200 59 OGDC-REG
Muhammad Nadeem A. Ghaffar 153 153 370 370 21,300 9 POL-REG
Pak Meezan Securities (Pvt.) Limited 161 161 017001 017001 20,500 1 OGDC-FWD
S. C. Securities (Private) Limited 112 112 711 711 20,500 1 OGDC-FWD
KASB Securities Limited 128 128 013600 013600 20,000 2 POL-REG
DJM Securities (Pvt.) Limited 16 16 12 12 19,500 2 OGDC-FWD
Moosani Securities (Pvt) Limited 158 158 101 101 19,400 5 OGDC-REG
Muhammad Nadeem A. Ghaffar 153 153 370 370 19,100 4 OGDC-REG
First Captial Equities Limited 57 57 110520 110520 19,000 1 PTC-REG
S. C. Securities (Private) Limited 112 112 711 711 18,500 1 POL-FWD
Worldwide Securities (Pvt.) Limited 196 196 A A 17,800 6 PSO-REG
A.H.K.D. Securities (Pvt.) Limited 178 178 11 11 17,600 1 POL-REG
First National Equities Limited 175 175 I I 17,300 3 OGDC-REG
Abdul Aziz Tayub Patel 116 116 447 447 17,000 3 OGDC-REG
Taurus Securities Limited 129 129 P P 16,500 14 OGDC-REG
Yousuf Ibrahim 89 89 HH HH 16,000 1 PTC-FWD
Aba Ali Habib 162 162 17 17 15,000 1 OGDC-FWD
AMZ Securities ( Pvt) Limited 167 167 50 50 15,000 1 POL-FWD
KASB Securities Limited 128 128 013758 013758 15,000 2 POL-REG
First Captial Equities Limited 57 57 110407 110407 15,000 1 PTC-REG
Moosa, Noor Mohammed, Shahzada & Co. 104 104 0450 0450 14,500 4 PTC-REG
Munaf Sattar Securities (Private) Limited 64 64 18001 18001 14,000 8 NBP-FWD
Sakarwala Capital Securities (Pvt.) Ltd. 10 10 130001 130001 14,000 1 PTC-REG
Escorts Investment Bank Limited 138 138 018 018 13,600 1 OGDC-REG
Aba Ali Habib 162 162 18 18 13,500 4 NBP-FWD
Muhammad Munir Muhammad Ahmed Khanani 84 84 801 801 13,000 1 OGDC-FWD
Mohammed Hussain Adhi 98 98 514 514 12,500 1 NBP-FWD
Aba Ali Habib 162 162 16 16 12,500 2 PSO-FWD
Arif Habib Securities Limited 50 50 0001 0001 12,500 3 POL-REG
Aqeel Karim Dhedhi Securities (Pvt.) Ltd. 19 19 1524 1524 11,000 1 POL-REG
DJM Securities (Pvt.) Limited 16 16 12 12 11,000 2 POL-REG
Moosani Securities (Pvt) Limited 158 158 101 101 10,500 3 PTC-REG
Muhammad Munir Muhammad Ahmed Khanani 84 84 475 475 10,500 2 PTC-REG
Time Securities (Private) Limited 36 36 09011 09011 10,500 3 PTC-REG
Invest Capital & Securities (Pvt) Ltd. 97 97 RSS RSS 10,000 1 OGDC-FWD
Mars Securities (Pvt) Ltd. 48 48 22 22 10,000 1 OGDC-FWD
Mohammed Hussain Adhi 98 98 72 72 10,000 5 OGDC-REG
Abdul Aziz Tayub Patel 116 116 447 447 10,000 1 PTC-REG
Mars Securities (Pvt) Ltd. 48 48 M01 M01 10,000 1 PTC-REG
Muhammad Munir Muhammad Ahmed Khanani 84 84 223 223 10,000 1 PTC-REG
Javed Omer Vohra & Co. Ltd. 151 151 65 65 9,500 1 NBP-FWD
Sherman Securities (Pvt.) Ltd. 6 6 31 31 9,500 1 PSO-REG
Moosani Securities (Pvt) Limited 158 158 351 351 9,500 19 PTC-REG
Alfa Adhi Securities (Pvt.) Ltd. 21 21 679 679 9,000 1 OGDC-FWD
First National Equities Limited 175 175 G G 9,000 6 OGDC-REG
Moosa, Noor Mohammed, Shahzada & Co. 104 104 0450 0450 9,000 3 OGDC-REG
Time Securities (Private) Limited 36 36 09011 09011 9,000 4 OGDC-REG
Bawa Securities (Pvt.) Ltd. 54 54 9/1 9/1 8,900 1 PSO-REG
Capital One Equities Limited 150 150 AA AA 8,900 1 PSO-REG
Aba Ali Habib 162 162 16 16 8,500 6 PSO-REG
M. S. Securities (Private) Limited 105 105 157 157 8,400 3 NBP-REG
Muhammad Nadeem A. Ghaffar 153 153 370 370 8,000 7 POL-FWD
First National Equities Limited 175 175 G G 8,000 3 PTC-REG
Abdul Majeed Zakaria 40 40 A19 A19 7,500 1 OGDC-FWD
First National Equities Limited 175 175 I I 7,500 1 NBP-REG
Taurus Securities Limited 129 129 P P 7,500 7 PTC-REG
Darson Securities (Private) Limited 90 90 L L 7,000 2 OGDC-FWD
A. R. Securities (Private) Limited 75 75 454 454 6,800 1 OGDC-REG
Sohail Raza Moosani 143 143 103 103 6,500 2 PTC-FWD
A.H.K.D. Securities (Pvt.) Limited 178 178 22 22 6,200 1 NBP-REG
Aba Ali Habib 162 162 16 16 6,000 2 POL-FWD
Sohail Raza Moosani 143 143 111 111 6,000 1 PTC-FWD
Finex Securities Limited 44 44 1103 1103 6,000 2 PTC-REG
Mars Securities (Pvt) Ltd. 48 48 8C 8C 6,000 1 PTC-REG
Bawa Securities (Pvt.) Ltd. 54 54 95 95 5,900 9 OGDC-REG
M. S. Securities (Private) Limited 105 105 420 420 5,800 3 OGDC-REG
Moosa, Noor Mohammed, Shahzada & Co. 104 104 0450 0450 5,700 8 PSO-REG
A.H.K.D. Securities (Pvt.) Limited 178 178 3 3 5,600 3 POL-REG
First Captial Equities Limited 57 57 110296 110296 5,500 2 PSO-FWD
Sohail Raza Moosani 143 143 113 113 5,500 5 PTC-FWD
Orix Investment Bank Pakistan Limited 77 77 0068 0068 5,100 1 PSO-REG
Elixir Securities Pakistan (Private) Limited 100 100 N683 N683 5,000 1 NBP-FWD
Concordia Securities (Pvt.) Ltd. 85 85 T10 T10 5,000 1 OGDC-FWD
DJM Securities (Pvt.) Limited 16 16 5 5 5,000 2 OGDC-FWD
Escorts Investment Bank Limited 138 138 930 930 5,000 1 OGDC-FWD
First National Equities Limited 175 175 I I 5,000 1 OGDC-FWD
Mars Securities (Pvt) Ltd. 48 48 5MK 5MK 5,000 1 OGDC-FWD
Yousuf Ibrahim 89 89 HH HH 5,000 1 OGDC-FWD
Zaitoon M. A. Shakoor 25 25 YKYZ34 YK YZ34 5,000 1 OGDC-FWD
First National Equities Limited 175 175 G G 5,000 1 POL-FWD
Finex Securities Limited 44 44 1103 1103 5,000 2 PTC-FWD
Ismail Abdul Shakoor 74 74 NAR NAR 5,000 1 PTC-FWD
Ismail Iqbal Securities (Pvt.) Limited 18 18 SS SS 5,000 10 PTC-FWD
Moosa, Noor Mohammed, Shahzada & Co. 104 104 0450 0450 5,000 1 PTC-FWD
Muhammad Junaid Memon 170 170 01/RANA 01/RANA 5,000 1 PTC-FWD
Prime Securities (Private) Limited 184 184 4112 4112 5,000 1 PTC-FWD
Zahoor Abdul Ghaffar 156 156 D D 5,000 1 PTC-FWD
Aba Ali Habib 162 162 18 18 5,000 1 NBP-REG
A.H.K.D. Securities (Pvt.) Limited 178 178 33 33 5,000 1 OGDC-REG
First Captial Equities Limited 57 57 110915 110915 5,000 1 OGDC-REG
A.H.K.D. Securities (Pvt.) Limited 178 178 00 00 5,000 1 POL-REG
Abdul Aziz Tayub Patel 116 116 329 329 5,000 1 PSO-REG
First Equity Modaraba 181 181 5 5 5,000 1 PSO-REG
AAG Securities (Pvt) Limited 118 118 05N 05N 5,000 1 PTC-REG
Escorts Investment Bank Limited 138 138 A044 A044 5,000 1 PTC-REG
Time Securities (Private) Limited 36 36 09011 09011 4,700 2 NBP-REG
Mars Securities (Pvt) Ltd. 48 48 5C 5C 4,500 1 OGDC-FWD
Aba Ali Habib 162 162 18 18 4,500 1 POL-FWD
Muhammad Anaf Kapadia 152 152 38 38 4,500 1 POL-FWD
First Captial Equities Limited 57 57 110664 110664 4,500 1 PSO-FWD
Worldwide Securities (Pvt.) Limited 196 196 5 5 4,500 1 PSO-FWD
KASB Securities Limited 128 128 024427 024427 4,500 1 POL-REG
Adam Securities (Pvt.) Ltd. 145 145 2038 2038 4,500 2 PTC-REG
DJM Securities (Pvt.) Limited 16 16 12 12 4,500 3 PTC-REG
HH Misbah Securities (Private) Limited 37 37 W45 W45 4,500 1 PTC-REG
First National Equities Limited 175 175 G G 4,400 8 POL-REG
Live Securities (Private) Limited 43 43 S31 S31 4,200 1 NBP-REG
Noman Abid & Company Limited 12 12 2005 2005 4,000 2 NBP-FWD
Elixir Securities Pakistan (Private) Limited 100 100 I108 I108 4,000 1 PTC-REG
Bawa Securities (Pvt.) Ltd. 54 54 95 95 3,800 13 NBP-REG
First National Equities Limited 175 175 CF CF 3,500 3 OGDC-FWD
Sohail Raza Moosani 143 143 112 112 3,500 1 OGDC-FWD
Sohail Raza Moosani 143 143 202 202 3,500 1 OGDC-FWD
Mars Securities (Pvt) Ltd. 48 48 CMS CMS 3,500 2 NBP-REG
Muhammad Anaf Kapadia 152 152 SD1 SD1 3,500 1 PSO-REG
Sherman Securities (Pvt.) Ltd. 6 6 9226 9226 3,500 5 PTC-REG
Worldwide Securities (Pvt.) Limited 196 196 A A 3,300 2 POL-REG
Aba Ali Habib 162 162 18 18 3,300 3 PSO-REG
Darson Securities (Private) Limited 90 90 415 415 3,100 3 POL-REG
Fawad Yusuf Securities (Private) Limited 88 88 30/251 30/251 3,000 1 NBP-FWD
Muhammad Farooq Haji Abdullah 93 93 FD FD 3,000 2 NBP-FWD
Sohail Raza Moosani 143 143 213 213 3,000 6 OGDC-FWD
A. Sattar Dawood Adhi 55 55 Z Z 3,000 1 POL-FWD
Apex Capital Securities (Private) Limited 188 188 G29 G29 3,000 1 PTC-FWD
Muhammed Siddiq Suleman 191 191 DSK DSK 3,000 1 NBP-REG
Taurus Securities Limited 129 129 B B 3,000 1 OGDC-REG
Darson Securities (Private) Limited 90 90 L L 3,000 1 POL-REG
Zillion Capital Securities (Pvt.) Ltd. 47 47 720 720 3,000 1 POL-REG
Jahangir Siddiqui Capital Markets Limited 149 149 2600 2600 3,000 1 PSO-REG
First National Equities Limited 175 175 J J 3,000 2 PTC-REG
Mr. Muhammad Shahid Durvesh 24 24 G31 G31 3,000 1 PTC-REG
Mohammed Hussain Adhi 98 98 72 72 2,900 3 POL-REG
Moosani Securities (Pvt) Limited 158 158 351 351 2,900 28 POL-REG
I. I. Kodvavi Securities (Private) Limited 169 169 100 100 2,600 2 POL-REG
Sikandar Esmail Ahmed Bagasrawala 140 140 20 20 2,500 1 NBP-FWD
Mars Securities (Pvt) Ltd. 48 48 QB QB 2,500 1 OGDC-FWD
SAZ Capital Securities (Pvt.) Ltd. 187 187 80040 80040 2,500 1 OGDC-FWD
Worldwide Securities (Pvt.) Limited 196 196 K K 2,500 1 POL-FWD
Abdul Jabbar Khanani 134 134 G1 G1 2,500 1 PSO-FWD
Sakarwala Capital Securities (Pvt.) Ltd. 10 10 IK IK 2,500 2 PSO-FWD
Mars Securities (Pvt) Ltd. 48 48 HR1 HR1 2,500 1 PTC-FWD
Sohail Raza Moosani 143 143 106 106 2,500 5 PTC-FWD
Friendly Securities ( Pvt.) Limited 163 163 UN UN 2,500 1 NBP-REG
Moosani Securities (Pvt) Limited 158 158 305 305 2,500 2 NBP-REG
Muhammad Anaf Kapadia 152 152 38 38 2,500 1 NBP-REG
Aba Ali Habib 162 162 12 12 2,500 1 POL-REG
A.H.K.D. Securities (Pvt.) Limited 178 178 R49 R49 2,500 1 PSO-REG
Moosani Securities (Pvt) Limited 158 158 305 305 2,500 1 PTC-REG
Motiwala Securities (Pvt.) Ltd. 198 198 2202 2202 2,500 1 PTC-REG
Bawa Securities (Pvt.) Ltd. 54 54 95 95 2,400 1 PSO-REG
Muhammad Anaf Kapadia 152 152 SD1 SD1 2,100 1 POL-REG
First National Equities Limited 175 175 CF CF 2,000 1 NBP-FWD
I. I. Kodvavi Securities (Private) Limited 169 169 318 318 2,000 1 NBP-FWD
Ismail Iqbal Securities (Pvt.) Limited 18 18 SS SS 2,000 4 NBP-FWD
Amin Siddique Parekh Securities (Pvt) Limited 166 166 F12 F12 2,000 1 OGDC-FWD
M. S. Securities (Private) Limited 105 105 574 574 2,000 1 OGDC-FWD
MAC Securities (Private) Limited 106 106 111 111 2,000 1 OGDC-FWD
Mohammed Hussain Adhi 98 98 72 72 2,000 1 OGDC-FWD
Abdul Aziz Tayub Patel 116 116 472 472 2,000 1 POL-FWD
Amin Siddique Parekh Securities (Pvt) Limited 166 166 F12 F12 2,000 2 POL-FWD
M. S. Securities (Private) Limited 105 105 574 574 2,000 2 POL-FWD
Munaf Sattar Securities (Private) Limited 64 64 15074 15074 2,000 2 POL-FWD
Sherman Securities (Pvt.) Ltd. 6 6 2824 2824 2,000 1 POL-FWD
Motiwala Securities (Pvt.) Ltd. 198 198 140 140 2,000 1 PSO-FWD
Muhammad Munir Muhammad Ahmed Khanani 84 84 475 475 2,000 1 PSO-FWD
Munaf Sattar Securities (Private) Limited 64 64 559001 559001 2,000 4 PSO-FWD
Noman Abid & Company Limited 12 12 961 961 2,000 1 PSO-FWD
Yousuf Ibrahim 89 89 HH HH 2,000 1 PSO-FWD
Adam Securities (Pvt.) Ltd. 145 145 2038 2038 2,000 1 PTC-FWD
Sohail Raza Moosani 143 143 213 213 2,000 4 PTC-FWD
Aziz Fidahusein & Co. (Pvt.) Ltd. 87 87 1ARK 1ARK 2,000 1 OGDC-REG
Zafar Moti Capital Securities (Pvt.) Ltd. 32 32 W390 W390 2,000 1 OGDC-REG
Moosa, Noor Mohammed, Shahzada & Co. 104 104 0450 0450 2,000 3 POL-REG
Muhammad Nadeem A. Ghaffar 153 153 L01 L01 2,000 1 POL-REG
First National Equities Limited 175 175 G G 2,000 3 PSO-REG
Jahangir Siddiqui Capital Markets Limited 149 149 3630 3630 2,000 1 PSO-REG
Time Securities (Private) Limited 36 36 09011 09011 2,000 1 PSO-REG
Global Securities Pakistan Limited 101 101 HA HA 2,000 1 PTC-REG
Ismail Iqbal Securities (Pvt.) Limited 18 18 SS SS 2,000 4 PTC-REG
Sohail Raza Moosani 143 143 112 112 2,000 1 PTC-REG
Moosani Securities (Pvt) Limited 158 158 305 305 1,900 1 OGDC-REG
Arif Habib Securities Limited 50 50 0022 0022 1,900 1 PSO-REG
Moosani Securities (Pvt) Limited 158 158 351 351 1,900 15 PSO-REG
Muhammad Hussain Abdul Karim 53 53 HI HI 1,900 1 PSO-REG
Siddiq Moti 111 111 A491 A491 1,800 1 POL-REG
Worldwide Securities (Pvt.) Limited 196 196 A A 1,700 1 NBP-REG
Eastern Capital Ltd. 7 7 S/ISL45 S/ISL45 1,700 1 PSO-REG
Mars Securities (Pvt) Ltd. 48 48 M01 M01 1,500 1 OGDC-FWD
DJM Securities (Pvt.) Limited 16 16 5 5 1,500 1 POL-FWD
Siddiq Moti 111 111 H1 H1 1,500 1 POL-FWD
Munaf Sattar Securities (Private) Limited 64 64 15074 15074 1,500 1 PSO-FWD
Altaf Adam 1 1 952 952 1,500 2 NBP-REG
Aba Ali Habib 162 162 18 18 1,500 1 POL-REG
Aqeel Karim Dhedhi Securities (Pvt.) Ltd. 19 19 1182 1182 1,500 1 POL-REG
Moosani Securities (Pvt) Limited 158 158 304 304 1,500 11 PSO-REG
Muhammad Anas Kapadia 68 68 AR276 AR276 1,500 1 PSO-REG
Mohammed Hussain Adhi 98 98 72 72 1,500 2 PTC-REG
Abdul Jabbar Khanani 134 134 D03 D03 1,300 1 OGDC-REG
MRA Securities (Private) Limited 194 194 01 01 1,300 2 OGDC-REG
Muhammad Munir Muhammad Ahmed Khanani 84 84 791 791 1,200 1 OGDC-REG
Salim M. Sozer 121 121 CO CO 1,200 1 POL-REG
Munaf Sattar Securities (Private) Limited 64 64 559001 559001 1,200 12 PSO-REG
Atlas Investment Bank Limited 17 17 201 201 1,100 1 NBP-REG
Mohammed Hussain Adhi 98 98 65 65 1,100 1 NBP-REG
Moosani Securities (Pvt) Limited 158 158 376 376 1,100 2 OGDC-REG
Ismail Iqbal Securities (Pvt.) Limited 18 18 SS SS 1,100 8 PSO-REG
Sherman Securities (Pvt.) Ltd. 6 6 4210 4210 1,100 2 PSO-REG
Mohammed Hussain Adhi 98 98 26 26 1,000 1 NBP-FWD
Muhammad Munir Muhammad Ahmed Khanani 84 84 475 475 1,000 1 NBP-FWD
Munaf Sattar Securities (Private) Limited 64 64 559001 559001 1,000 2 NBP-FWD
Altaf Adam 1 1 951 951 1,000 1 OGDC-FWD
Invest Capital & Securities (Pvt) Ltd. 97 97 MS MS 1,000 1 OGDC-FWD
Ismail Abdul Shakoor 74 74 JSQ JSQ 1,000 1 OGDC-FWD
Mohammed Saad Maniar 96 96 L034 L034 1,000 1 OGDC-FWD
Moosa, Noor Mohammed, Shahzada & Co. 104 104 0450 0450 1,000 1 OGDC-FWD
Sikandar Esmail Ahmed Bagasrawala 140 140 20 20 1,000 1 OGDC-FWD
Azee Securities (Pvt.) Ltd. 108 108 5564 5564 1,000 1 POL-FWD
First Captial Equities Limited 57 57 110296 110296 1,000 2 POL-FWD
HH Misbah Securities (Private) Limited 37 37 E1 E1 1,000 1 POL-FWD
Invest Capital & Securities (Pvt) Ltd. 97 97 RZ RZ 1,000 1 POL-FWD
Muhammad Hussain Abdul Karim 53 53 JA JA 1,000 1 POL-FWD
SAZ Capital Securities (Pvt.) Ltd. 187 187 07 07 1,000 1 POL-FWD
Sikandar Esmail Ahmed Bagasrawala 140 140 24126 24126 1,000 1 POL-FWD
Sohail Raza Moosani 143 143 103 103 1,000 2 POL-FWD
DJM Securities (Pvt.) Limited 16 16 12 12 1,000 1 PSO-FWD
FDM Capital Securities (Private) Limited 94 94 U38 U38 1,000 1 PSO-FWD
Khawaja Amir Ishaq 119 119 G14 G14 1,000 1 PSO-FWD
MRA Securities (Private) Limited 194 194 01 01 1,000 1 PSO-FWD
Sohail Raza Moosani 143 143 103 103 1,000 2 PSO-FWD
Sohail Raza Moosani 143 143 213 213 1,000 2 PSO-FWD
First National Equities Limited 175 175 SS SS 1,000 1 PTC-FWD
Mars Securities (Pvt) Ltd. 48 48 ECM ECM 1,000 1 PTC-FWD
Mohammed Hussain Adhi 98 98 72 72 1,000 1 PTC-FWD
Altaf Adam 1 1 917 917 1,000 1 NBP-REG
KASB Securities Limited 128 128 013304 013304 1,000 1 NBP-REG
Mohammed Hussain Adhi 98 98 72 72 1,000 1 NBP-REG
Aqeel Karim Dhedhi Securities (Pvt.) Ltd. 19 19 1031 1031 1,000 1 OGDC-REG
Bawa Securities (Pvt.) Ltd. 54 54 9/42 9/42 1,000 1 OGDC-REG
Darson Securities (Private) Limited 90 90 2430 2430 1,000 1 OGDC-REG
Escorts Investment Bank Limited 138 138 A044 A044 1,000 1 OGDC-REG
Malik Khan Awan 137 137 005006 005006 1,000 1 OGDC-REG
Mars Securities (Pvt) Ltd. 48 48 8C 8C 1,000 1 OGDC-REG
Zillion Capital Securities (Pvt.) Ltd. 47 47 720 720 1,000 1 OGDC-REG
Amanullah Haji Mohammed Marfani 73 73 AHAD AHAD 1,000 2 POL-REG
Escorts Investment Bank Limited 138 138 A044 A044 1,000 1 POL-REG
First National Equities Limited 175 175 J J 1,000 2 POL-REG
Invest Capital & Securities (Pvt) Ltd. 97 97 6 6 1,000 2 POL-REG
MAC Securities (Private) Limited 106 106 J69 J69 1,000 1 PSO-REG
Noman Abid & Company Limited 12 12 1085 1085 1,000 1 PSO-REG
Abbasi Securities (SMC-Pvt.) Limited 61 61 956 956 1,000 1 PTC-REG
Malik Khan Awan 137 137 2057 2057 1,000 1 PTC-REG
Sohail Raza Moosani 143 143 113 113 1,000 2 PTC-REG
Aba Ali Habib 162 162 18 18 900 1 OGDC-REG
First Captial Equities Limited 57 57 110296 110296 700 2 POL-REG
Sherman Securities (Pvt.) Ltd. 6 6 9226 9226 700 7 PSO-REG
Moosani Securities (Pvt) Limited 158 158 376 376 600 2 NBP-REG
Escorts Investment Bank Limited 138 138 901 901 600 1 OGDC-REG
Aba Ali Habib 162 162 372 372 600 1 POL-REG
Abdul Jabbar Khanani 134 134 D03 D03 600 1 POL-REG
Multiline Securities (Pvt.) Ltd. 49 49 01 01 600 2 POL-REG
Taurus Securities Limited 129 129 P P 600 2 POL-REG
A.H.K.D. Securities (Pvt.) Limited 178 178 11 11 600 1 PSO-REG
Ample Securities (Pvt.) Limited 171 171 Q3 Q3 500 1 NBP-FWD
Jahangir Siddiqui Capital Markets Limited 149 149 3986 3986 500 1 NBP-FWD
Muhammad Anas Kapadia 68 68 AF1 AF1 500 1 NBP-FWD
Altaf Adam 1 1 9 9 500 1 OGDC-FWD
Invest Capital & Securities (Pvt) Ltd. 97 97 6 6 500 1 OGDC-FWD
Khawaja Amir Ishaq 119 119 T4 T4 500 1 OGDC-FWD
Muhammad Anas Kapadia 68 68 MP41 MP41 500 1 OGDC-FWD
Munaf Sattar Securities (Private) Limited 64 64 15074 15074 500 1 OGDC-FWD
Munaf Sattar Securities (Private) Limited 64 64 559001 559001 500 1 OGDC-FWD
Orix Investment Bank Pakistan Limited 77 77 0072 0072 500 1 OGDC-FWD
Sohail Raza Moosani 143 143 113 113 500 1 OGDC-FWD
AAG Securities (Pvt) Limited 118 118 14S 14S 500 1 POL-FWD
Amanullah Haji Mohammed Marfani 73 73 6016 6016 500 1 POL-FWD
Bawa Securities (Pvt.) Ltd. 54 54 9/2 9/2 500 1 POL-FWD
First Captial Equities Limited 57 57 110361 110361 500 1 POL-FWD
Haji Ghani Haji Usman 28 28 153 153 500 1 POL-FWD
Munaf Sattar Securities (Private) Limited 64 64 559001 559001 500 1 POL-FWD
Sohail Raza Moosani 143 143 112 112 500 1 POL-FWD
Worldwide Securities (Pvt.) Limited 196 196 Y Y 500 1 POL-FWD
Zaitoon M. A. Shakoor 25 25 YK YZ91 YK YZ91 500 1 POL-FWD
Rafi Securities (Private) Limited 159 159 680 680 500 1 PSO-FWD
Worldwide Securities (Pvt.) Limited 196 196 Y Y 500 1 PSO-FWD
First National Equities Limited 175 175 CF CF 500 1 PTC-FWD
Memon Securities (Private) Limited 92 92 49 19 49 19 500 1 PTC-FWD
Motiwala Securities (Pvt.) Ltd. 198 198 AFTAB AFTAB 500 1 PTC-FWD
Muhammad Munir Muhammad Ahmed Khanani 84 84 475 475 500 1 PTC-FWD
Munaf Sattar Securities (Private) Limited 64 64 546172 546172 500 1 PTC-FWD
Sakarwala Capital Securities (Pvt.) Ltd. 10 10 IK IK 500 1 PTC-FWD
Worldwide Securities (Pvt.) Limited 196 196 71 71 500 1 PTC-FWD
Worldwide Securities (Pvt.) Limited 196 196 J J 500 1 PTC-FWD
Abdul Aziz Tayub Patel 116 116 330 330 500 1 NBP-REG
Mars Securities (Pvt) Ltd. 48 48 8C 8C 500 1 NBP-REG
Muhammad Anas Kapadia 68 68 AF1 AF1 500 1 NBP-REG
Bawa Securities (Pvt.) Ltd. 54 54 5/39 5/39 500 1 OGDC-REG
Moosani Securities (Pvt) Limited 158 158 303 303 500 1 OGDC-REG
Moosani Securities (Pvt) Limited 158 158 355 355 500 1 OGDC-REG
Muhammad Anas Kapadia 68 68 AF1 AF1 500 1 OGDC-REG
Rafi Securities (Private) Limited 159 159 221 221 500 1 OGDC-REG
Abdul Jabbar Khanani 134 134 101 101 500 1 POL-REG
Mars Securities (Pvt) Ltd. 48 48 8C 8C 500 1 POL-REG
Time Securities (Private) Limited 36 36 09011 09011 500 1 POL-REG
Zafar Moti Capital Securities (Pvt.) Ltd. 32 32 305 305 500 1 POL-REG
Al - Asar Securities (Private) Limited 34 34 A A 500 1 PSO-REG
Mars Securities (Pvt) Ltd. 48 48 X205 X205 500 1 PSO-REG
Mohammed Hussain Adhi 98 98 72 72 500 1 PSO-REG
Muhammad Munir Muhammad Ahmed Khanani 84 84 475 475 500 1 PSO-REG
Adam Securities (Pvt.) Ltd. 145 145 2042 2042 500 1 PTC-REG
DJM Securities (Pvt.) Limited 16 16 6 6 500 1 PTC-REG
Khawaja Amir Ishaq 119 119 AWJ AWJ 500 1 PTC-REG
Moosani Securities (Pvt) Limited 158 158 311 311 500 1 PTC-REG
Moosani Securities (Pvt) Limited 158 158 354 354 500 1 PTC-REG
Muhammad Munir Muhammad Ahmed Khanani 84 84 A82 A82 500 1 PTC-REG
Sohail Raza Moosani 143 143 103 103 500 1 PTC-REG
Zafar Moti Capital Securities (Pvt.) Ltd. 32 32 W390 W390 500 1 PTC-REG
Abdul Jabbar Khanani 134 134 H1 H1 400 1 POL-REG
Darson Securities (Private) Limited 90 90 606 606 400 1 PSO-REG
Invest Capital & Securities (Pvt) Ltd. 97 97 1 1 400 1 PSO-REG
Moosani Securities (Pvt) Limited 158 158 305 305 400 2 PSO-REG
Moosani Securities (Pvt) Limited 158 158 311 311 300 3 OGDC-REG
Motiwala Securities (Pvt.) Ltd. 198 198 1823 1823 300 2 POL-REG
Darson Securities (Private) Limited 90 90 415 415 300 2 PSO-REG
Moosani Securities (Pvt) Limited 158 158 311 311 300 3 PSO-REG
Siddiq Moti 111 111 I I 300 1 PSO-REG
Taurus Securities Limited 129 129 P P 300 1 PSO-REG
FDM Capital Securities (Private) Limited 94 94 U94 U94 200 1 OGDC-REG
Munaf Sattar Securities (Private) Limited 64 64 559001 559001 200 2 OGDC-REG
Bawa Securities (Pvt.) Ltd. 54 54 95 95 200 2 POL-REG
Finex Securities Limited 44 44 1103 1103 200 1 POL-REG
Fortune Securities Limited 46 46 B B 200 2 POL-REG
Motiwala Securities (Pvt.) Ltd. 198 198 109 109 200 1 POL-REG
Muhammad Javed Surmawala 35 35 1539 1539 200 1 POL-REG
Sherman Securities (Pvt.) Ltd. 6 6 9226 9226 200 2 POL-REG
Sohail Raza Moosani 143 143 103 103 200 2 POL-REG
Darson Securities (Private) Limited 90 90 646 646 200 1 PSO-REG
First Captial Equities Limited 57 57 111191 111191 200 1 PSO-REG
Adam Securities (Pvt.) Ltd. 145 145 66/2 66/2 100 1 NBP-REG
Moosani Securities (Pvt) Limited 158 158 304 304 100 1 NBP-REG
Munaf Sattar Securities (Private) Limited 64 64 559001 559001 100 1 NBP-REG
KASB Securities Limited 128 128 116654 116654 100 1 OGDC-REG
Moosani Securities (Pvt) Limited 158 158 308 308 100 1 OGDC-REG
Moosani Securities (Pvt) Limited 158 158 353 353 100 1 OGDC-REG
Noman Abid & Company Limited 12 12 1240 1240 100 1 OGDC-REG
Rafi Securities (Private) Limited 159 159 411 411 100 1 OGDC-REG
Sohail Raza Moosani 143 143 103 103 100 1 OGDC-REG
Sohail Raza Moosani 143 143 113 113 100 1 OGDC-REG
Bawa Securities (Pvt.) Ltd. 54 54 5/39 5/39 100 1 POL-REG
Eastern Capital Ltd. 7 7 S/1 S/1 100 1 POL-REG
ACE Securities (Private) Limited 67 67 3214 3214 100 1 PSO-REG
Fortune Securities Limited 46 46 B B 100 1 PSO-REG
Invest Capital & Securities (Pvt) Ltd. 97 97 5 5 100 1 PSO-REG
Motiwala Securities (Pvt.) Ltd. 198 198 2202 2202 100 1 PSO-REG
Sohail Raza Moosani 143 143 103 103 100 1 PSO-REG
=============================================================================================================================================
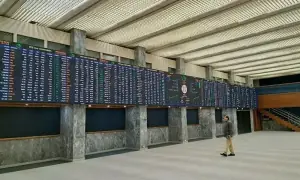














Comments
Comments are closed for this article.