



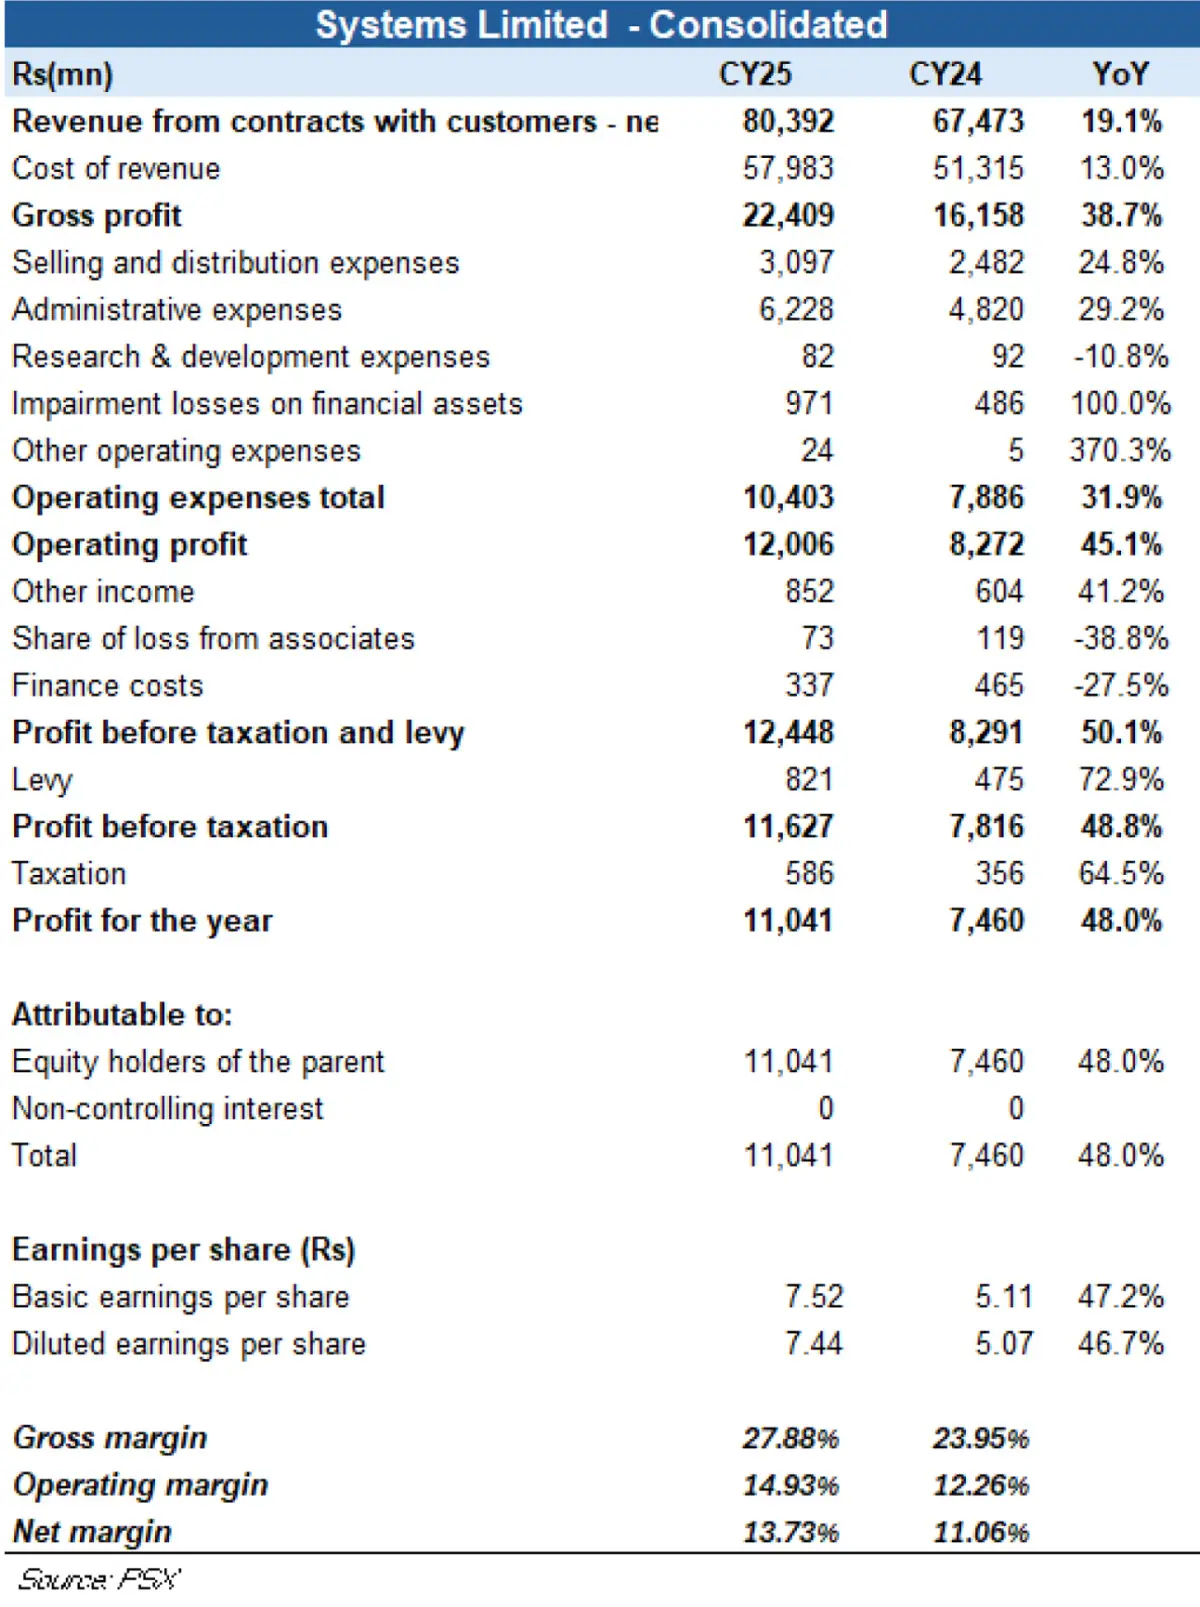
Systems Limited did more than grow in CY25—it grew better. Revenue rose a solid 19.1 percent year-on-year to Rs80.4 billion, but profit after tax jumped much faster, up 48 percent year-on-year to Rs11 billion. For an IT services company, this signals not just higher sales, but stronger execution, better margins, and improved earnings quality.
The real strength in CY25 was not just revenue growth, but the quality of that growth. Revenue rose 19.1 percent year-on-year, while gross profit grew much faster at 38.7 percent, lifting gross margin to 27.9 percent from 24.0 percent. That points to a business scaling with greater efficiency, where better execution, tighter fixed-cost control, and improved billing efficiency, which suggests the earnings improvement was driven by better execution rather than only topline momentum.
The revenue mix also looks supportive. Growth was broad-based, with strong contributions from telecom, technology, and BFSI, while geographically the Middle East remained the largest market at 59 percent of revenue, followed by North America and Pakistan as highlighted in the latest analyst briefing.
Management also highlighted that 91 percent of revenue is in foreign currencies, while only 43 percent of costs are in foreign currency. That gives Systems a naturally favourable cost structure, because a large part of its expense base remains rupee-linked while much of its billing is dollar or other hard-currency based. This helps explain why earnings growth outpaced revenue growth in CY25.
That said, a few points still need watching. Operating expenses increased 31.9 percent year-on-year broadly in line with the strong scale-up in business activity, and taxation rose sharply, which partly offset the benefit of higher operating profit. North America growth also appears to have been relatively constrained, with management noting dependence on associated companies as a limitation. In addition, while the Middle East remains a major strength, such concentration also creates regional exposure if demand or geopolitics weaken. So CY25 was clearly strong, but part of the investment case still depends on how well Systems diversifies growth across regions and sustains margin discipline.
The outlook for SYS remains strong and positive. Management expects the Confiz acquisition to start contributing from the first quarter of CY26, with synergies likely to build over the following two to three quarters. It is also optimistic about cross-selling, upselling, AI-related demand, and further inorganic growth, while demand in the Middle East has remained steady so far. In short, Systems exits CY25 with solid operating momentum and enters CY26 with both organic growth drivers and acquisition-led momentum.


















Comments
Comments are closed for this article.