


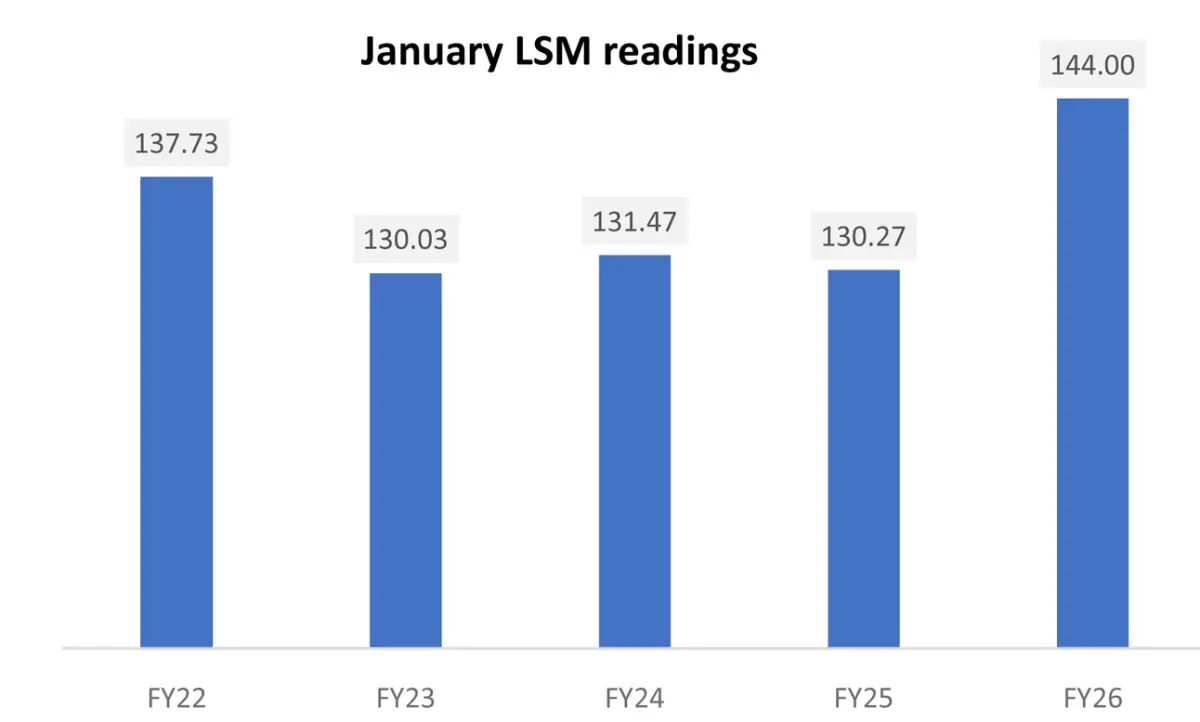
Large-Scale Manufacturing bounced back strongly in January 2026, reversing the mild deceleration seen in December and reinforcing the view that the recovery is now on firmer ground. Year-on-year growth came in at 10.54 percent, the highest since June 2022, while the monthly index reading reached an all-time high.
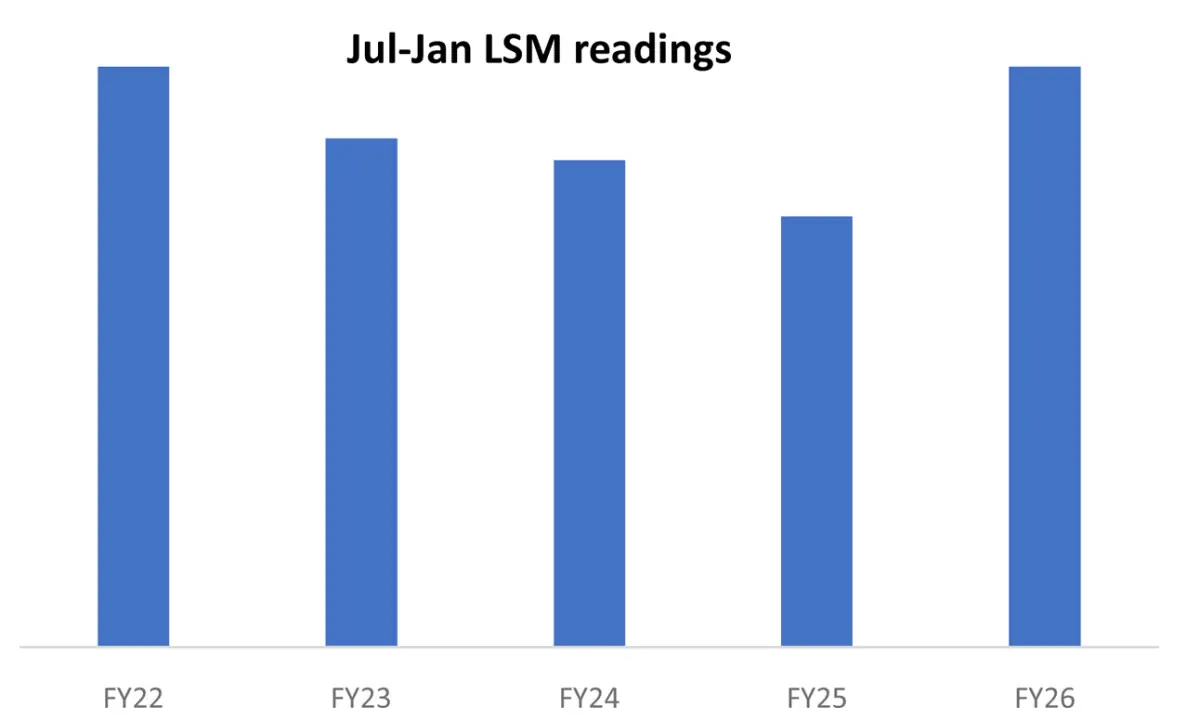
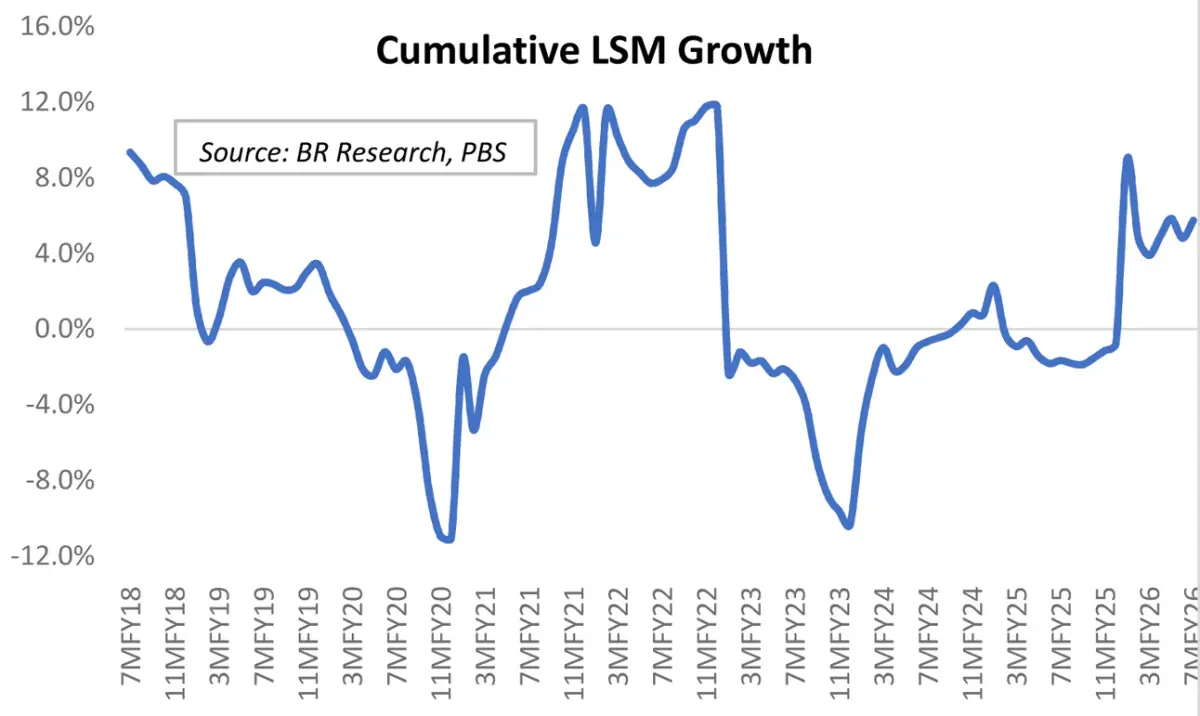
On a cumulative basis, LSM growth for 7MFY26 stands at 5.75 percent, broadly in line with full-year expectations, with the July to January index also the highest ever recorded for the period.
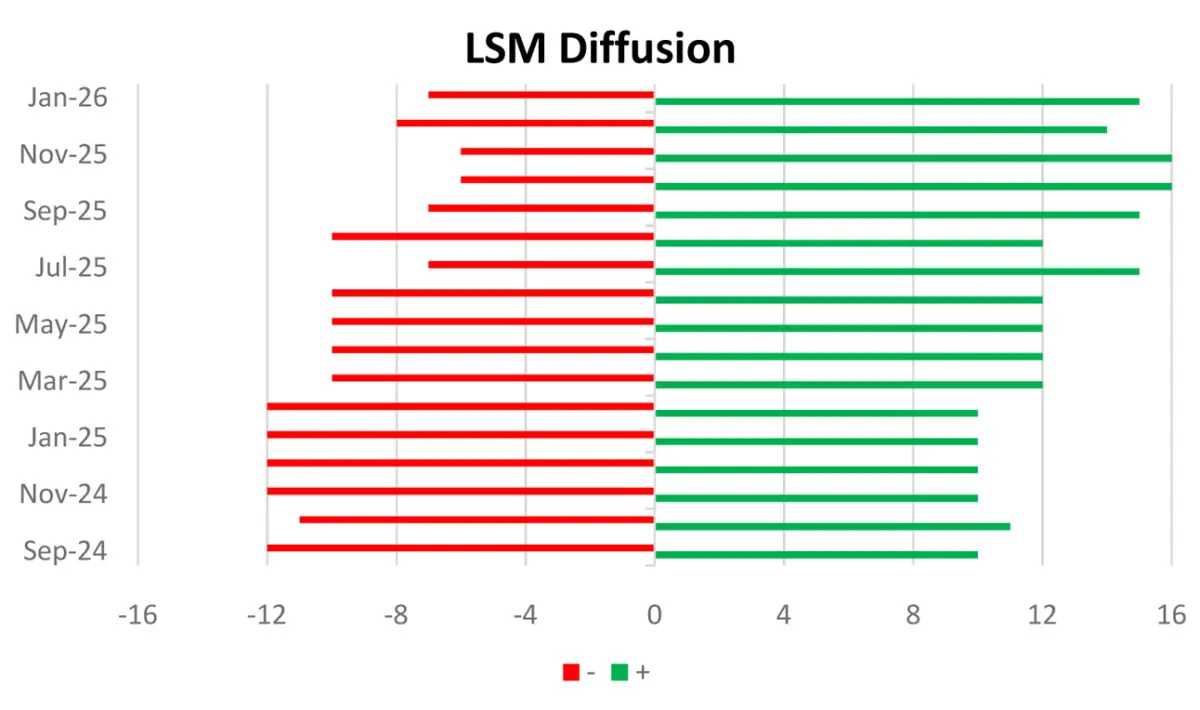
The strength of the latest reading lies not just in the headline number, but in the continued expansion of the growth base. Fifteen out of 22 sub-sectors are now in positive territory.
The seven sectors still contracting are largely confined to low single-digit declines and carry relatively smaller weights, suggesting that the drag on aggregate growth is limited. The recovery is increasingly synchronized across sectors rather than concentrated in a few outperformers.
The food sector emerged as a standout contributor in January. The food index reached its highest level in LSM history, led by a surge in sugar production. Monthly sugar output stood at 2.23 million tons, the highest ever for January, up 24 percent year-on-year and nearly 7 percent higher on a cumulative basis. This translated into the largest single contribution to LSM growth for the month, marking a clear shift from earlier periods where food played a more muted role.
Wearing apparel continues to provide consistent support. Readymade garment export quantities reached a new monthly peak of 8.56 million dozen pieces in January, with cumulative growth for 7MFY26 at around 8 percent.
The segment remains one of the most reliable contributors, although its relative dominance has eased as other sectors have stepped up.
Automobiles remain central to the cumulative growth story. The sector continues to post strong figures, with car production in January reaching a 43-month high and jeep production reaching an all-time peak. On a cumulative basis, automobiles lead overall contribution, followed by wearing apparel and petroleum.
What distinguishes the current phase from earlier recoveries is the diversification of growth drivers.
Food, petroleum, and cement have all made meaningful contributions alongside the traditional pillars of automobiles and garments. This diffusion of growth reduces vulnerability to sector-specific shocks and lends greater credibility to the overall expansion.
Policy tailwinds are beginning to reinforce this trend. Industrial electricity tariffs have been reduced significantly compared to last year, improving cost structures and supporting incremental output. Combined with an easing interest rate cycle, these factors are creating conditions conducive to sustained capacity utilization and output growth.
That said, the benchmark of FY22 remains distant. Matching those levels would require LSM growth to average close to 20 percent over the remaining five months, an outcome that appears highly unlikely.
External risks also remain in play. The evolving conflict in the Middle East could yet disrupt the trajectory through its impact on energy prices, supply chains, and export demand. The extent of the risk will depend on the duration and intensity of the conflict.
For now, the data suggests that LSM has not only recovered momentum after December’s pause but has also strengthened the foundations of its expansion. Growth is broader, more balanced, and increasingly supported by both domestic and external drivers.


Comments