


Pakistan’s core foreign direct investment (FDI) problem is not only how much capital flows in—but how narrow the investor base is, and how easily outflows wipe out the gains. The December 2025 numbers and the cumulative picture for 1HFY26 reinforce a familiar but worrying pattern: inflows continue to arrive, yet retention remains weak, leaving net FDI volatile and fragile.
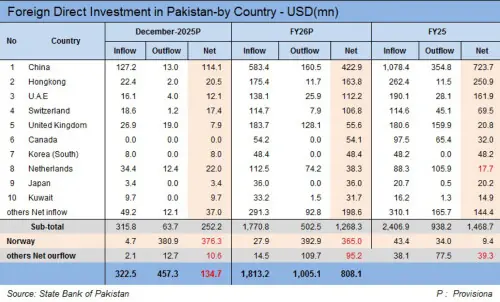
According to provisional data from the State Bank of Pakistan, December 2025 recorded gross FDI inflows of $322.5 million, but these were more than offset by outflows of $457.3 million, resulting in a net outflow of $134.7 million. This was one of the weakest monthly net readings of FY26 and highlights a recurring feature of Pakistan’s FDI profile—positive inflows that are quickly diluted by profit repatriation, loan repayments, and equity withdrawals.
A key drag in December was Norway, which posted a net outflow of $376.3 million, overwhelming otherwise positive contributions from major partners such as China ($114.1 million net) and Hong Kong ($20.5 million net). This episode illustrates the structural fragility of Pakistan’s FDI: when investment is concentrated in a handful of sources, a single large repatriation can flip the entire monthly balance from positive to negative.
READ MORE: FDI plunges 43% in 1HFY26
The broader picture is more stable but still underwhelming. Pakistan attracted $1.81 billion in FDI inflows, while outflows totalled $1.01 billion, leaving net FDI at $808.1 million. While significant, this level of net inflows remains modest relative to Pakistan’s financing needs and growth ambitions. Once again, China dominated, contributing $583.4 million in inflows and $422.9 million in net FDI, largely linked to power, infrastructure, and allied sectors—underscoring the continued concentration risk.
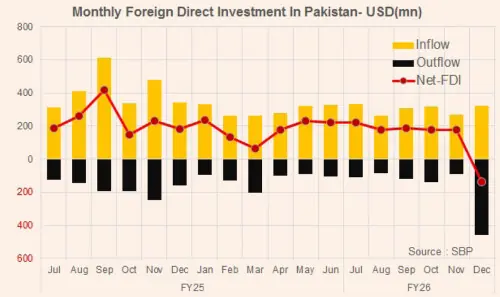
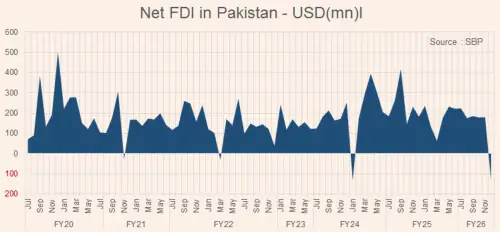
Monthly data across FY25 and FY26 shows high volatility in net FDI, driven less by new project announcements and more by the timing of outflows. Even in months with healthy inflows, net FDI frequently disappoints because repatriation events are large, lumpy, and concentrated.
This pattern suggests Pakistan’s challenge is not only about attracting sizeable capital—but about retaining it. Incentives alone will not fix this. What investors need is predictability: stable foreign exchange and repatriation rules, fewer approvals, and consistent enforcement. Without this, capital may enter—but it will not stay, reinvest, or bring others with it.


















Comments
Comments are closed for this article.