


Buxly Paints Limited (PSX: BUXL) was incorporated in Pakistan as a private limited company in1954 and then was converted into a public limited company in 1985. The company is engaged in the manufacturing of sale of pigments and paints, varnishes, protective surface coating and other related products. The company has a toll manufacturing agreement with Berger Paints Limited. Besides catering to the local market, the company also exports its products to Far East and Middle East.
Pattern of Shareholding
As of June 30, 2023, BUXL has a total of 1.44 million shares outstanding which are held by 834 shareholders. Associated companies account for 56.64 percent shares of BUXL followed by the local general public having a 35.64 percent stake in the company. Mutual funds hold 3.28 percent of the company’s shares while foreign public hold 2.57 percent shares. The remaining shares are held by other categories of shareholders.
Historical Performance (2019-24)
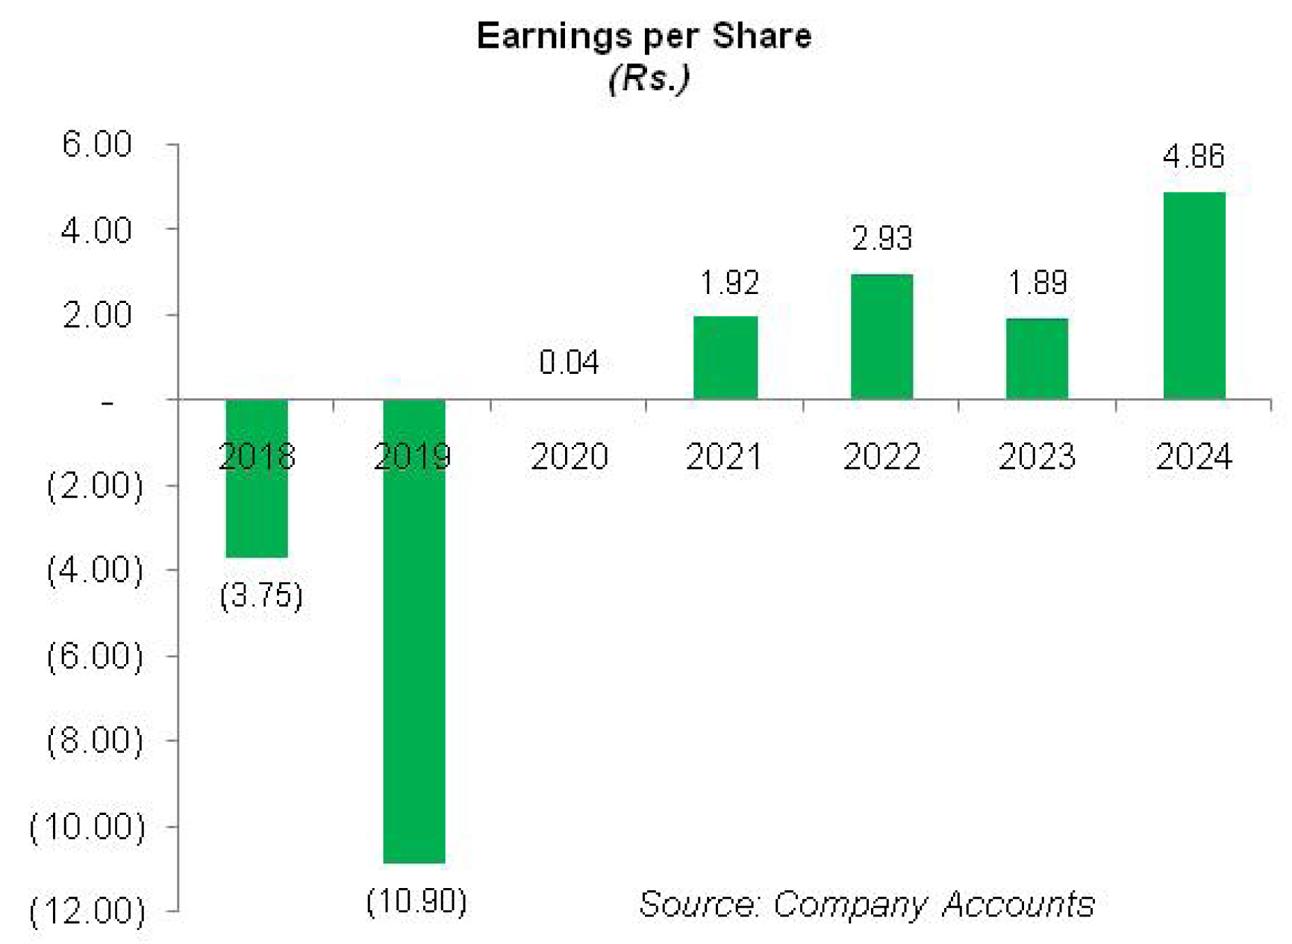
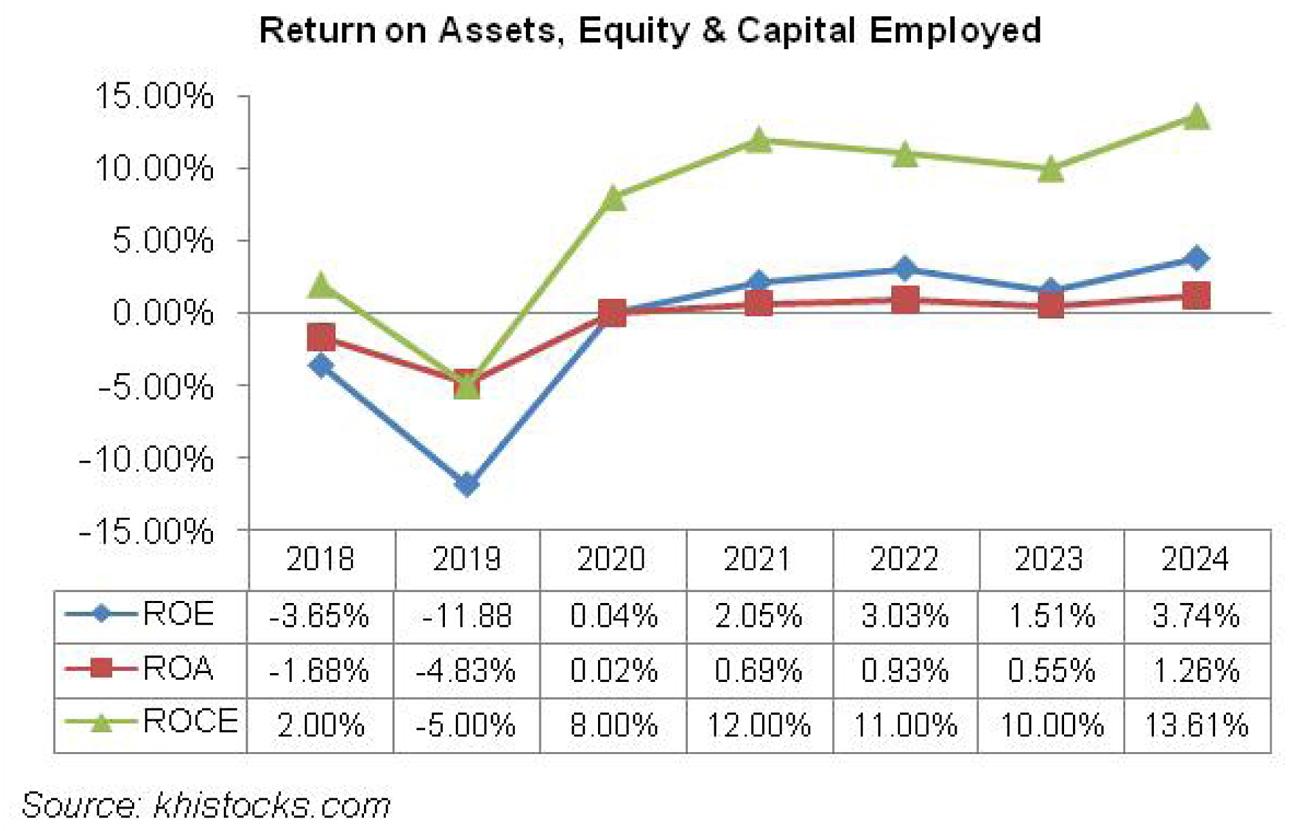
Except for a year-on-year slide in 2019, the topline of BUXL has posted growth over the period under consideration. The bottomline of BUXL which had been in the negative zone in 2018 and 2019 started posting profits thereafter. Net profit kept growing until 2022 followed by a decline in 2023. In 2024, BUXL’s net profit jumped up to boast its highest level. The company’s margins which considerably plunged in 2019 registered noticeable improvement in 2020. In 2021, gross margin fell while operating and net margins rebounded. 2022 witnessed erosion in BUXL’s gross and operating margins which recovered in the subsequent year with the exception of net margin which plummeted. In 2024, all the margins picked up (see the graph of profitability ratios). The detailed performance review of the period under consideration is given below.
In 2019, the company was able to record low off-take on the back of cutthroat competition in the industry. The company raised the prices of its products to compensate for the increase in the cost of sales in line with the inflationary pressure. However, not only did the topline slide by 18.34 percent year-on-year to clock in at Rs.256.67 million, gross profit also slipped by 35.70 percent in 2019. This resulted in a GP margin of 12.1 percent in 2019 versus a GP margin of 15.32 percent in 2018. The company kept a check on its operating expenses, yet couldn’t be successful in attaining operating profit in 2019. Its operating loss stood at Rs.12.14 million in 2019, 440 percent higher than the operating loss posted by the company in the previous year. Other income grew by 9.45 percent year-on-year in 2019 mainly on account of rental income made by renting its land and building to Berger Paints Pakistan Limited, however, the gain was largely offset by 37.54 percent higher finance cost on the back of an increased discount rate and high short-term working capital finance obtained during the year. BUXL posted a net loss worth Rs. 15.70 million in 2019 as against a net loss of Rs. 5.4 million in the previous year. Loss per share stood at Rs.10.90 versus loss per share of Rs.3.75 posted by the company in 2018.
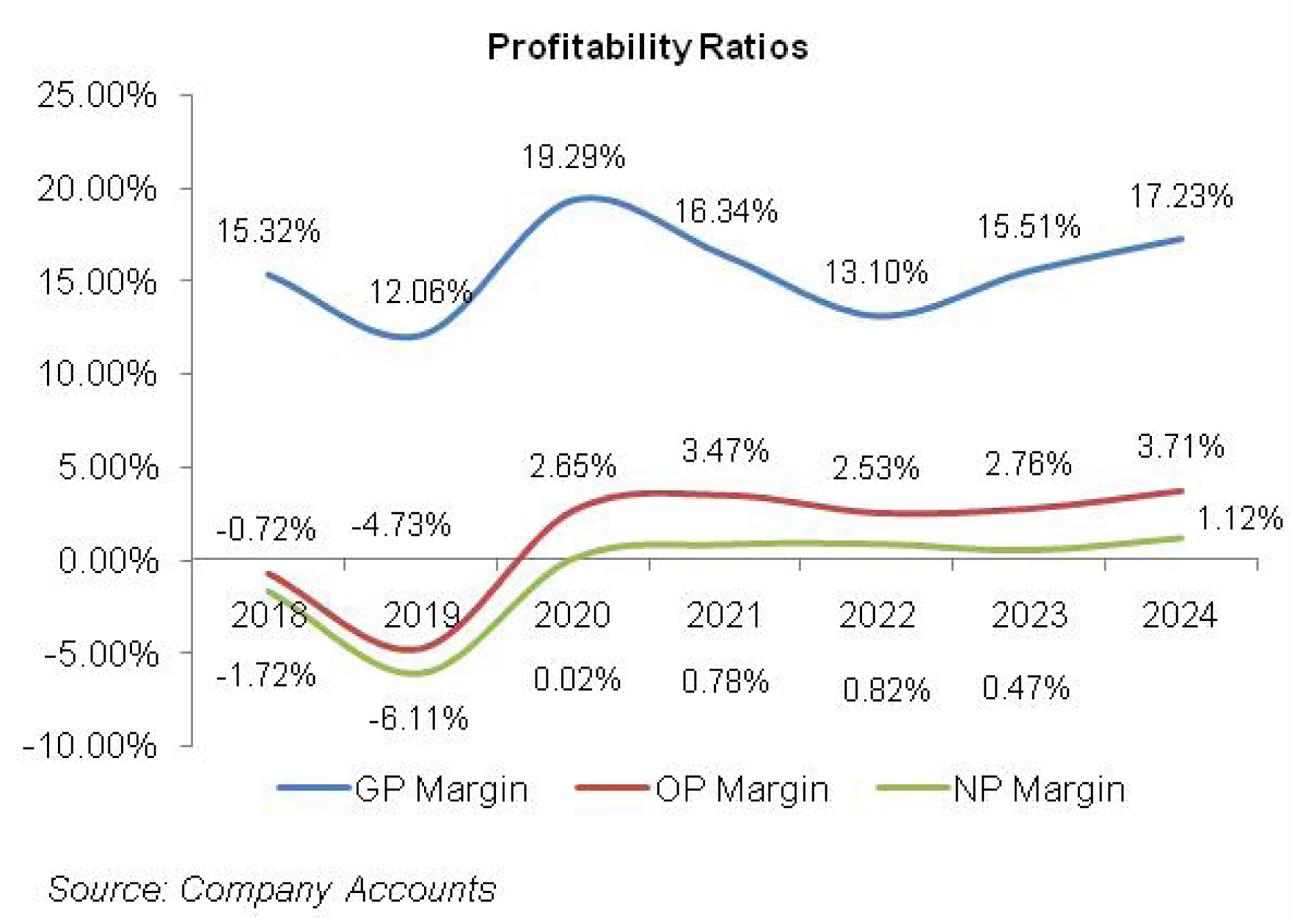
In 2020, the company registered topline growth of 7.23 percent year-on-year which was the combined effect of high sales volume and upward price revisions. Net sales stood at Rs. 275.22 million in 2020. Rigorous cost control measures enabled BUXL to cut down its cost of sales by 1.59 percent year-on-year which resulted in a year-on-year increase of 71.51 percent in BUXL’s gross profit with GP margin clocking in at 19.29 percent. Operating expenses grew in line with inflation, but the company was in a strong position to absorb them and post an operating profit of Rs 7.29 million versus operating losses posted in 2018 and 2019. OP margin stood at 2.65 percent in 2020. Finance costs grew by 19.94 percent in 2020 as the discount rate was high for the first three quarters of 2020. Other income didn’t paint a good picture either mainly on the back of a massive drop in royalty income from Berger Paints Pakistan Limited, an associated entity of BUXL. This squeezed the bottom line growth, yet BUXL was able to post a net profit of Rs.0.05 million with EPS of Rs.0.04 and NP margin of 0.02 percent.
While the topline grew with a greater magnitude i.e. 28.83 percent and 45.66 percent respectively in 2021 and 2022, high cost of sales resulted in a plunge in GP margins which stood at 16.34 percent and 13.10 percent in 2021 and 2022 respectively. This was despite a 9.12 percent and 16.80 percent rise in gross profit recorded in 2021 and 2022 respectively. OP margin was recorded at 3.47 percent in 2021 with 68.92 percent growth in its operating profit as the company cut back on its distribution expense; however, OP margin slid back to 2.5 percent in 2022 as distribution expense rose up on the back of higher payroll expense, advertising & promotion expense as well as traveling expense. In 2022, operating profit registered a marginal 6.13 percent rise. Finance costs increased by 9.91 percent in 2021 despite a low discount rate as the company procured more short-term financing during the year. In 2022, while the discount rate was on the rise, the company was able to cut its finance cost by 32.56 percent year-on-year as it immensely reduced its short-term borrowings during the year. Net profit grew by 5217.31 percent in 2021 to clock in at Rs.2.76 million with EPS of Rs.1.92. In 2022, net profit grew by 52.33 percent to clock in at Rs.4.21 million with EPS of Rs.2.93. NP margin of both 2021 and 2022 was almost the same i.e. 0.8 percent.
In 2023, BUXL’s topline mounted by 11.73 percent to clock in at Rs.577.08 million. The company was able to attain a tremendous growth of 32.24 percent in its gross profit in 2023 on the back of upward price revisions and cost-control measures implemented during the year. Distribution expense hiked by 20.35 percent in 2023 on the back of a significant rise in carriage outward as well as traveling & conveyance charges. Administrative expenses registered a massive 80.37 percent spike in 2023 on account of impairment loss on ECL. Operating profit mounted by 21.65 percent in 2023 with OP margin slightly rising up to stand at 2.76 percent. Finance costs escalated by 66.14 percent in 2023 on the back of a high discount rate. This pushed the bottom line down by 35.5 percent to clock in at Rs.2.72 million with EPS of Rs.1.89. NP margin receded to clock in at 0.47 percent in 2023.
In 2024, BUXL’s net sales ticked up by 7.96 percent to clock in at Rs.622.99 million. This was the result of increased sales volume and price optimization. This culminated in a 19.91 percent year-on-year improvement in gross profit in 2024 with GP margin clocking in at 17.23 percent. Distribution expense mounted by 11.88 percent in 2024 due to increased salaries of sales staff, higher carriage outward as well as elevated travel & conveyance charges incurred during the year. Administrative expenses also multiplied by 19.79 percent in 2024 due to increased payroll expenses on account of inflationary pressure. Operating profit strengthened by 45.29 percent in 2024 with OP margin rising up to 3.71 percent. Other income posted a marginal 0.41 percent growth in 2024 due to higher mark-up income on TDRs. Finance costs grew by 24.19 percent in 2024 due to higher discount rates and increased short-term borrowings obtained during the year. Other expenses surged by 28.41 percent in 2024 due to higher provisioning done for WWF and WPPF. Net profit registered a staggering year-on-year growth of 157.75 percent to clock in at Rs.7 million in 2024. This translated into EPS of Rs.4.86 and NP margin of 1.12 percent.
Recent Performance (1QFY25)
In 1QFY25, BUXL’s topline slid by 11.48 percent to clock in at Rs.307.44 million. This was the result of lower sales volume on the back of a drop in construction activities. Gross profit ticked down by 1.67 percent in 1QFY25; however, the GP margin was recorded at 19 percent versus the GP margin of 17.13 percent recorded in 1QFY24. Lower sales volume resulted in a 9.23 percent dip in BUXL’s distribution expense in 1QFY25. Conversely, administrative expenses mounted by 54.22 percent due to inflationary pressure. Operating profit shrank by 38.51 percent in 1QFY25 with OP margin tapering off from 4.21 percent in 1QFY24 to 2.93 percent in 1QFY25. Finance cost also slid by 18.16 percent in 1QFY25 due to the onset of monetary easing coupled with a decline in outstanding short-term borrowings. Lesser profit-related provisioning translated into a 42.57 percent year-on-year plunge in other expenses in 1QFY25. Net profit stood at Rs.1.94 million in 1QFY25, down 66.20 percent year-on-year. This translated into EPS of Rs.1.35 in 1QFY25 versus EPS of Rs.3.99 recorded in 1QFY24. NP margin also eroded from 1.65 percent in 1QFY24 to 0.63 percent in 1QFY25.
Future Outlook
Sluggish real-estate activity coupled with the low purchasing power of consumers is expected to keep BUXL’s volumes under pressure in the coming times. The top line might see price-led growth as the company is increasingly tapping avenues to optimize its sales mix and discover new opportunities in the paint industry. The company must also tap new product markets or enter new geographical markets. This will not only expand its margins and bottom-line growth but will also give it an edge in the industry.


Comments
Comments are closed for this article.