


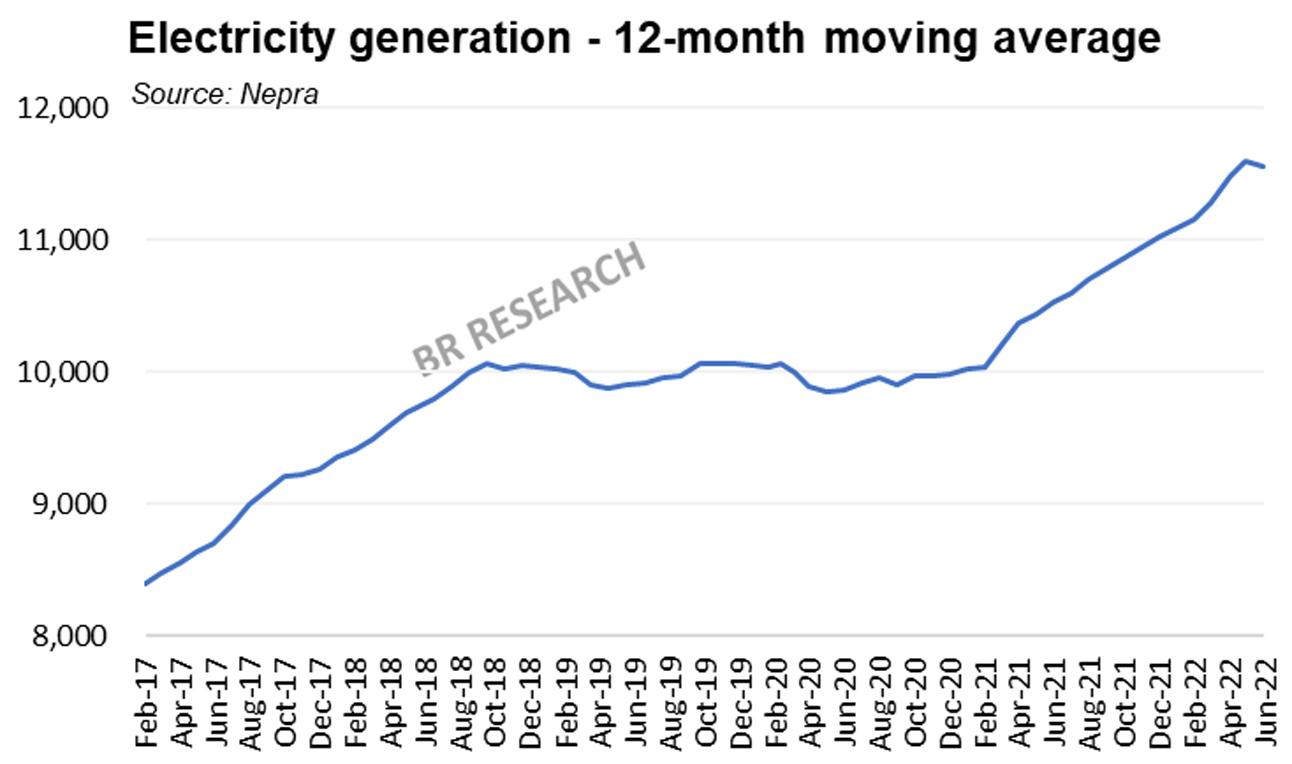
Pakistan’s grid power generation in FY22 at 139 billion units stood 10 percent higher year-on-year – and comfortably the highest every yearly number. There are early signs of a widespread slowdown in economic activities in June generation, which at 13.5 billion units went down by 4 percent year-on-year. This is the first incidence of negative year-on-year growth since peak Covid days of May 2020.
In terms of the generation mix, the major base load contributors, natural gas, imported RLNG and coal – returned virtually similar generation numbers of last year. The contribution from hydel sources went down to a 25 percent share – down from 5-year average share of 38 percent. The onus of the 10 percent increased generation fell to furnace oil – with the share increasing from 5 percent last year to 9.2 percent – generation more than doubling to 13 billion units.

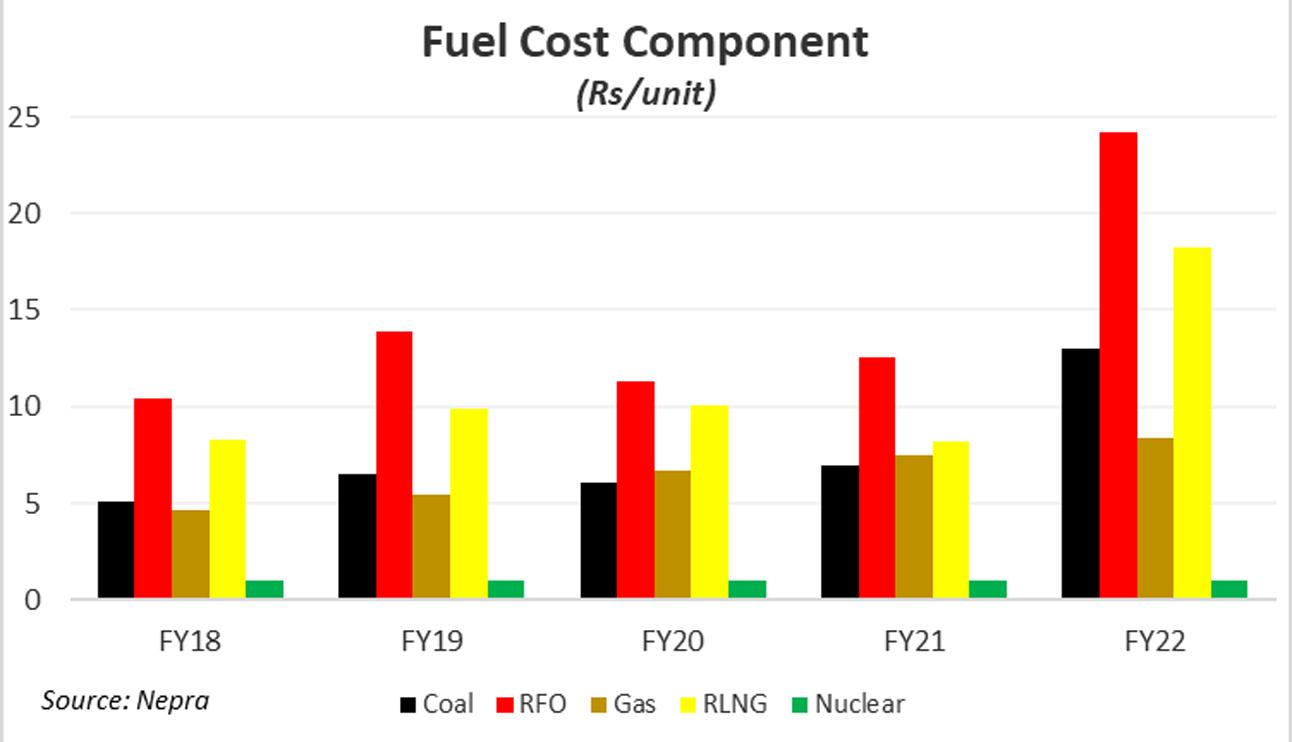
On the bright side, the biggest increase came from nuclear sources, with the share rising from 8 percent last year to 13 percent – generating an additional 7 billion units over last year. Generating an additional 10 percent units of electricity cost 111 percent more year-on-year, in fuel costs. That is how bad things were – as the global commodity super cycle, especially in the second half of the year wreaked havoc.
The rupee depreciation further played its part in augmenting fuel charges – which went up from Rs5.2 per unit in FY21 to Rs10.1 per unit for FY22. For the second month running, total generation fuel cost closed in at a billion dollars, led by RLNG, constituting half the fuel cost with one-fourth share in total generation. Recall that the government was found itself between a rock and a hard place on RLNG imports. Faced with growing criticism over long hours of load shedding, RLNG imports were arranged at record highs, inflating the fuel bill. Generating power from RLNG cost Rs28.3 per unit in June – the highest ever.

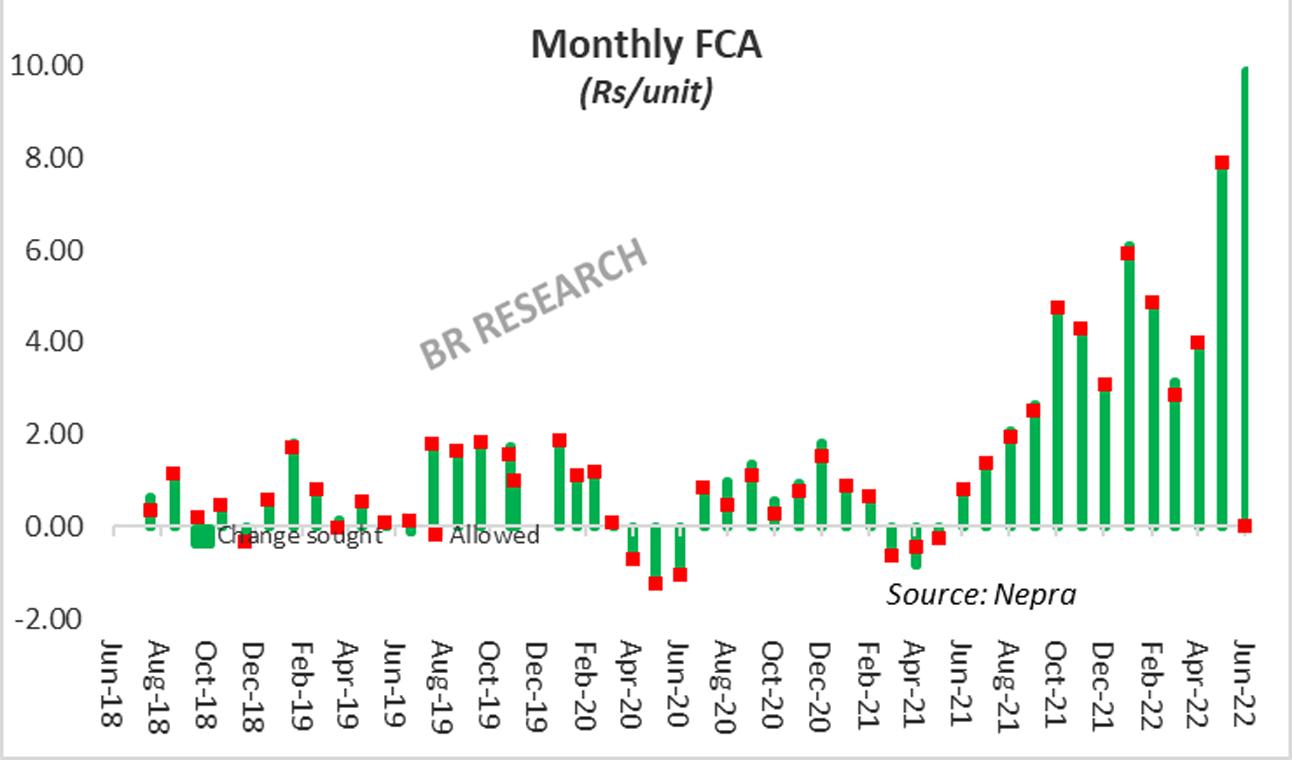
The fuel charges adjustment sought for June 2022 stands at a staggering Rs10 per unit – as the generation cost of Rs15.84 per unit beats the reference fuel cost of Rs5.93/unit by some distance. The average upwards monthly FCA in FY22 stood at Rs4.6 per unit, in stark contrast to the 3-year average monthly FCA requirement of Rs0.5 per unit from FY19-FY21.
Going forward, it will continue to be a tough ask keeping fuel cost in control. Even if the commodity prices reverse appreciably, the currency depreciation over the past three months alone would keep fuel cost over and above the reference tariffs in the foreseeable future. The recent loss of generation from Guddu power plant and problems with Neelum Jehlum are only going to make matters worse.


Comments
Comments are closed for this article.