


Economies of scale is considered the bed rock of achieving cost advantage over competitors. In industries such as modern retail, consumers also reap the benefits of scale, as sellers such as Walmart and Amazon are able to offer superior discounts due to cost minimization gained from bulk buying. But what happens when the benefit of scale is not passed on to consumers?
Domestic sugar industry is one example where gains from scale for producers are tremendous. Because players in the sector routinely complain that cost of production varies substantially between regions due to inherent differences such as sucrose recovery and cost of raw material (sugarcane), BR Research calculated the cost of raw material consumed to produce a kg of sugar for all listed players for past two seasons, and compared it to their respective market shares. The result of the exercise is presented below.
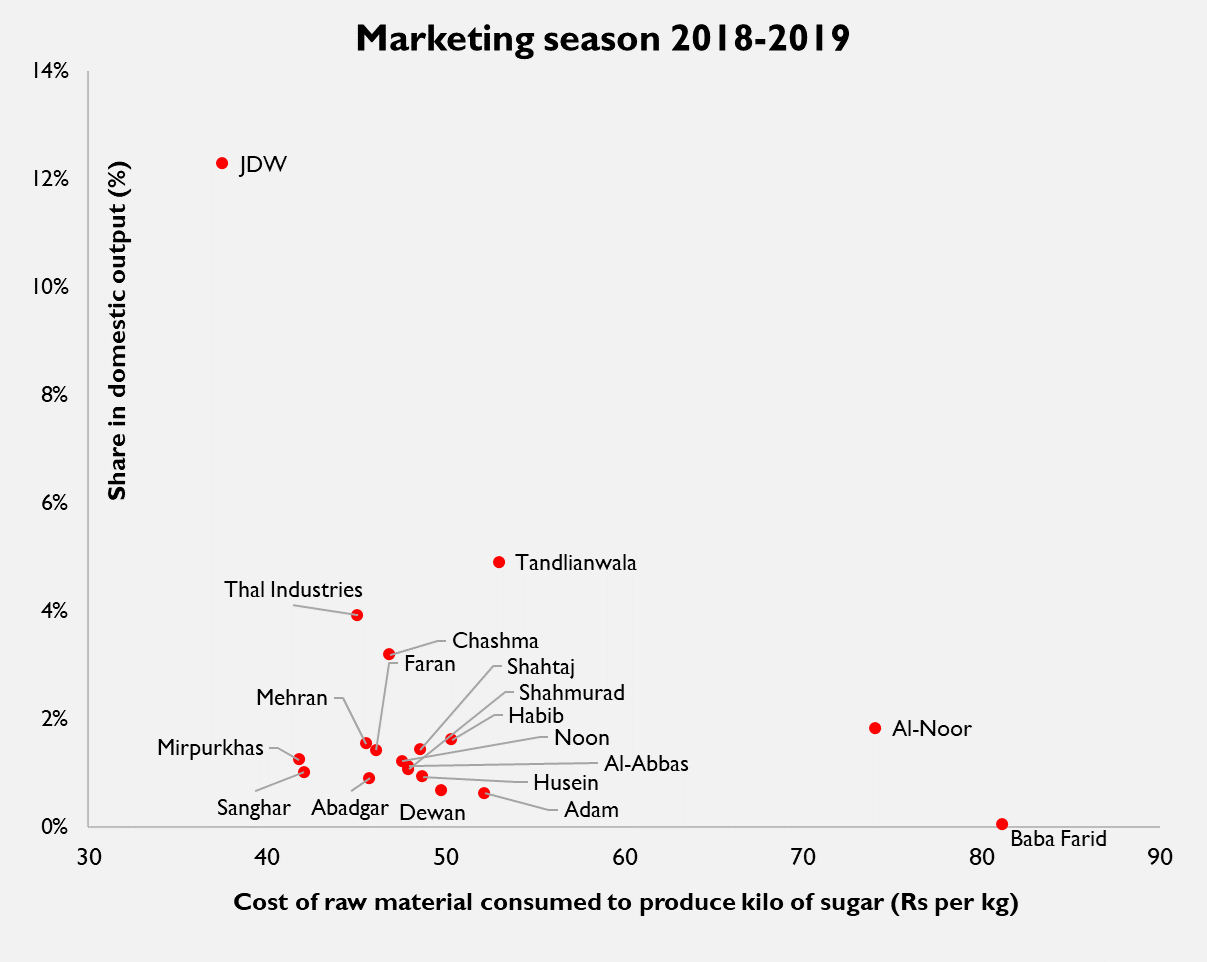
Consider that during 2018-19 season – when the upward spiral in domestic retail prices first began – median cost of raw material consumed to produce a kilo of sugar (for listed players only) averaged at Rs 51 per kg. Because the industry claims that cost of raw material constitutes 80 percent of total cost of production, median cost of production of the industry during the year may be estimated close to Rs 61 per kilo. Average market share of these players was no more than 2.5 percent of total national output.
However, during the same period, cost of raw material consumed (to produce a kg of sugar) for the industry leader JDW stood at just Rs 37 per kg, a whopping 35 percent less than average for listed players. JDW standalone (excluding subsidiaries, and other sponsor group holdings) stood at 11.4 percent during that year, 2.40 times greater than the second largest player in the industry.
The story in the most recent marketing year 2019-20 appears to be no different. Based on latest financials of listed companies, cost of raw material consumed for the industry giant was 34 percent less than average for other listed players – just Rs 47.3 per kg compared to Rs 63.6 per kg for the rest.

This is not to raise suspicions on the business practices of the industry leader – which is a KSE-100 company audited by a top auditor– nor to imply that other players report inflated cost. Consider that based on reported financials, most players paid at least minimum support price for procurement of sugarcane during both marketing seasons; on average basis, listed players paid 12 percent premium over MSP in MY19, and a substantial 34 percent premium over MSP in MY20. Meanwhile, the industry leader ensured that its raw material cost was no more than MSP during both years.
But considering that the price of output – sugar – has nearly doubled in two years, what do these sharp differences mean for the consumer? Even if industry leader’s cost of production is lowest – due to efficiencies in production – its market share is barely sufficient to determine pricing for the whole industry. On the other hand, high cost of production for an otherwise highly fragmented market means that consumers ending up paying for producers’ inefficiencies.
Will the sugar industry – which by the way supplies 80 percent of its volume to B2B commercial consumers – be better off if there is more consolidation? Or will the industry be more equitable if concentration by few large players were to be disallowed? Researchers and economists should pay heed.


Comments
Comments are closed for this article.