




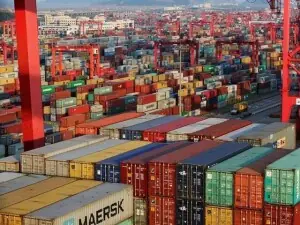
Despite a marked decline in automobile volumes over the past year—and a host of demand suppressing factors indicating that volumes should decline as a consequence (price hikes, high inflation, reduced purchasing power amid stagnant incomes, ballooning cost of borrowing)—BR Research has argued that volumes were down predominantly due to import restrictions. Sales are hinged on the availability of imported parts. Ergo, when import restrictions ease, volumes will begin to display signs of improvement. It doesn’t come as a shock then that in Aug-23, passenger car sales (including SUVs, and LCVs) have grown by 49 percent. This aligns well with a month-on-month increase in July of CKD imports (up 78%).
An earlier BR Research column analysing industry performance for FY23 contended: “Since June-22, rupee depreciated by 40 percent on a monthly average basis, during which time, prices rose on average by 55 percent—various models have seen different level of price hikes. Numbers reflect poorly on whatever localization or import substitution has occurred as dependence on imported content has not wavered. During the year, CKD kit imports (by value) dropped 61 percent. Accounting for the rupee depreciation which made the same quantum of parts more expensive, the resulting 55 percent drop in vehicle volumes could be entirely explained by the import restrictions and the subsequent decline in imports. Demand probably never came to play”.

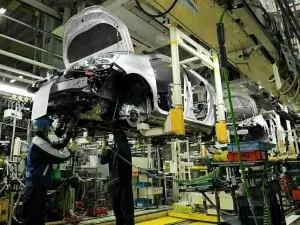
With the ability of OEMs to import necessary parts for assembly, August volumes show demand is not going anywhere. The month’s sales are higher than any month since Mar-23. In Mar-23, there was a slight jump in sales. At the time, this column wrote this: “If there ever was a doubt that there is significant latent demand for cars in Pakistan, March of this fiscal year alone could satisfy that curiosity. Volumes during the month jumped 66 percent compared to the previous month which at times like these should be astounding. Nearly all players have performed under capacity over the past several months because they did not have the required materials to keep plants running. Import restrictions had tied their hands in the back. But a slight redressal in LCs was able to boost volumes during the month. Despite mind you, much more expensive cars, high cost of borrowing, and other inflationary products specially fuel”.
Each time the supply restrictions adjusted course; volumes were affected more purposefully. This is not to say that automobile volumes are vibrant or growingand demand has not hampered sales at all. In 2MFY24, automobile volumes are down 47 percent from last year’s dismal sales. But that, it has thus far been impossible to truly estimate the impact of demand dampeners on volumes. Import restrictions did not allow that. But to be sure, demand will now be infull display as assemblers are able to produce as many units as they believe can sell in this market, without piling up inventories.
The two big numbers that stick out like a thumb are this: a) the market share of LCVs and SUVs has grown substantially—from last year’s 18 percent to this fiscal year’s 24 percent (for 2M), and b) Alto’s singular share in the total industry performance stands at 33 percent (vs 2MFY23: 29%). What is this data telling us, more on that next time.

















Comments
Comments are closed for this article.