BR100 Decreased By (-1.49%)
BR30 Decreased By (-1.14%)
KSE100 Decreased By (-0.85%)
KSE30 Decreased By (-1.61%)
AGHA 6.12 Decreased By ▼ -0.06 (-0.97%)
BECO 4.15 Decreased By ▼ -0.08 (-1.89%)
BML 60.90 Decreased By ▼ -0.94 (-1.52%)
BOP 30.91 Decreased By ▼ -0.79 (-2.49%)
CNERGY 12.11 Increased By ▲ 0.05 (0.41%)
CSIL 5.66 Increased By ▲ 0.03 (0.53%)
FCCL 58.21 Decreased By ▼ -0.50 (-0.85%)
FFL 13.40 Decreased By ▼ -0.07 (-0.52%)
FNEL 1.17 No Change ▼ 0.00 (0%)
KEL 6.10 Decreased By ▼ -0.04 (-0.65%)
KOSM 5.61 Decreased By ▼ -0.05 (-0.88%)
LOTCHEM 24.35 Decreased By ▼ -0.47 (-1.89%)
MLCF 100.19 Decreased By ▼ -1.90 (-1.86%)
NBP 175.81 Decreased By ▼ -3.85 (-2.14%)
NCPL 51.90 Increased By ▲ 1.85 (3.7%)
NPL 53.93 Increased By ▲ 1.03 (1.95%)
OGDC 313.80 Decreased By ▼ -2.44 (-0.77%)
PACE 9.24 Increased By ▲ 0.03 (0.33%)
PAEL 33.55 Decreased By ▼ -0.47 (-1.38%)
PIBTL 13.23 Decreased By ▼ -0.19 (-1.42%)
PPL 218.10 Decreased By ▼ -3.20 (-1.45%)
PRL 85.50 Increased By ▲ 0.90 (1.06%)
PTC 47.45 Decreased By ▼ -0.93 (-1.92%)
SSGC 22.65 Decreased By ▼ -0.29 (-1.26%)
TBL 9.20 Decreased By ▼ -0.10 (-1.08%)
TELE 7.17 Increased By ▲ 0.10 (1.41%)
TPL 25.50 Decreased By ▼ -0.36 (-1.39%)
TPLP 13.15 Increased By ▲ 0.04 (0.31%)
TREET 24.55 Decreased By ▼ -0.44 (-1.76%)
TRG 53.58 Decreased By ▼ -0.45 (-0.83%)
Markets

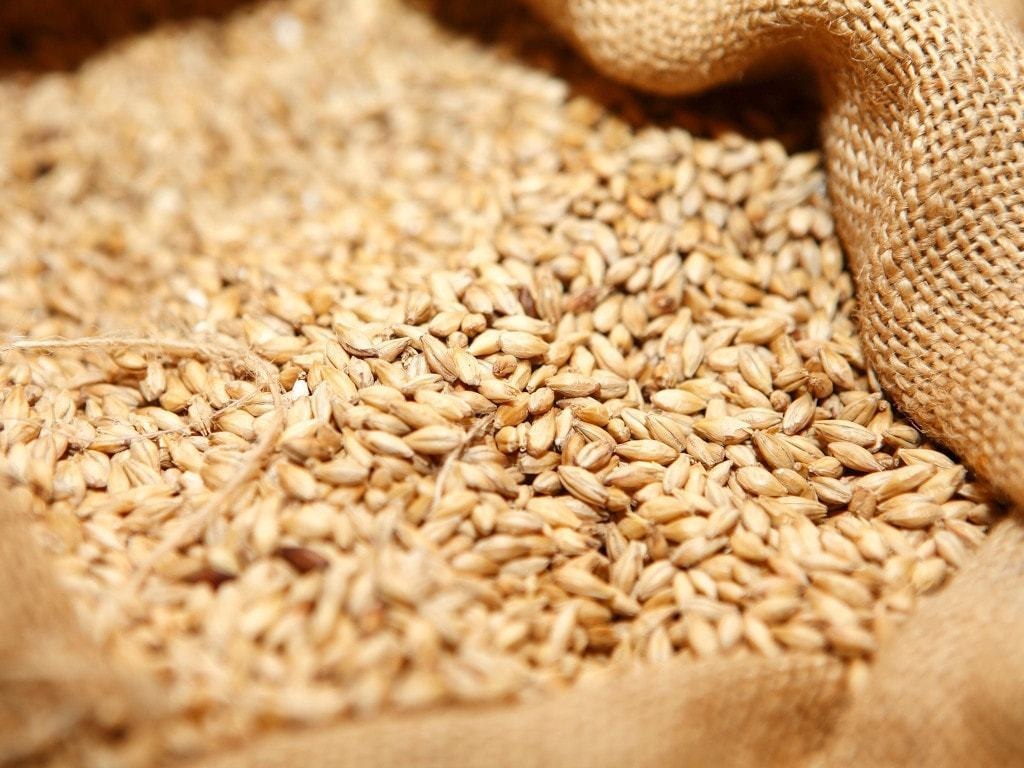
CBOT wheat may retest resistance at $6.21-1/2

  • On the daily chart, the current bounce is expected to be matching the one from the Jan. 25 low of $6.26.
Published Updated
By

SINGAPORE: CBOT May wheat may retest a resistance at $6.21-1/2 per bushel, a break above which could lead to a gain to $6.30-1/2.

The contract is riding on a wave c, which is expected to be roughly equal to preceding wave a from the March 31 low of $5.93-1/4.

Even though wheat failed twice to break a falling trendline, the target zone of $6.30-1/2 to $6.37-1/4 remains intact.

A drop below $6.11-1/2, however, will greatly change the technical picture.

Such a drop could signal either the extension of the wave b or the continuation of the downtrend towards $5.95-3/4.

On the daily chart, the current bounce is expected to be matching the one from the Jan. 25 low of $6.26.

That means the bounce may take a few weeks to complete and eventually expand towards a range of $6.43 to $6.54-3/4. Even a drop below $6.07-3/4 won't have a big impact on this bullish outlook, as this drop will probably be limited to $6.

Each reader should consult his or her own professional or other advisers for business, financial or legal advice regarding the products mentioned in the analyses.

Comments

Comments are closed for this article.