


Century Paper & Board Mills Limited: performance and outlook
Century Paper & Board Mills experienced initial growth (2021) but faced declining profits and net losses from 2022-2026 due to economic challenges, competition, and rising costs.
- CEPB's financial performance trends (2021-2026).
- Key factors impacting profitability and sales volumes.
- Future outlook and market challenges for the company.

Century Paper & Board Mills Limited (CEBP) was incorporated in Pakistan as a public limited company in 1984 and began its commercial operations in 1990.
The principal activity of the company is the manufacturing of paper, board and related products. The company is a part of Lakson Group of Companies. The company also entered into corrugated cartons manufacturing business in 2003.
Pattern of Shareholding
As of June 30 2025, CEPB has a total of 401.713 million shares outstanding which are held by 4082 shareholders. Associated companies, undertakings and related parties have the majority stake of 68.66 percent in the company followed by local general public holding 13.62 percent shares of CEPB.
Around 7.67 percent of the company’s shares are held by Modarabas and Mutual Funds while Banks, DFIs and NBFIs account for 2.76 percent of the outstanding shares of CEPB.
Insurance companies have 2.39 percent stake in the company. The remaining shares are held by other categories of shareholders.
Financial Performance (2021-26)
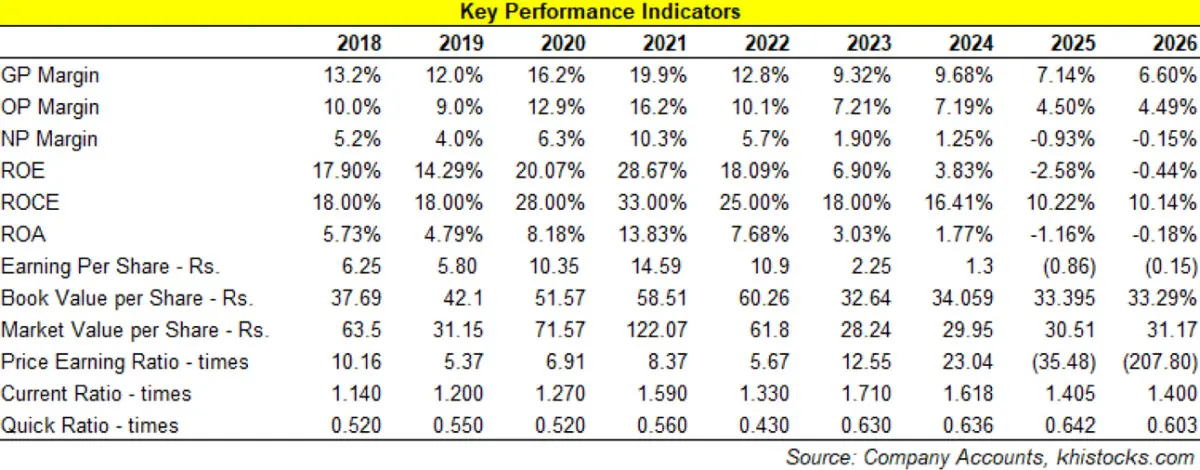
CEPB’s topline posted steady year-on-year growth until 2023 followed by a decline in 2024 and 2025. In 2026, net sales ticked up. Conversely, its bottomline posted growth only in 2021. The company registered net losses in 2025 and 2026. CEPB’s margins posted significant growth in 2021 followed by a downward course for the next two years.
In 2024, gross margin slightly picked up while operating and net margins continued to descend. The margins further deteriorated in 2025 and 2026. The detailed performance overview of the period under consideration is given below:
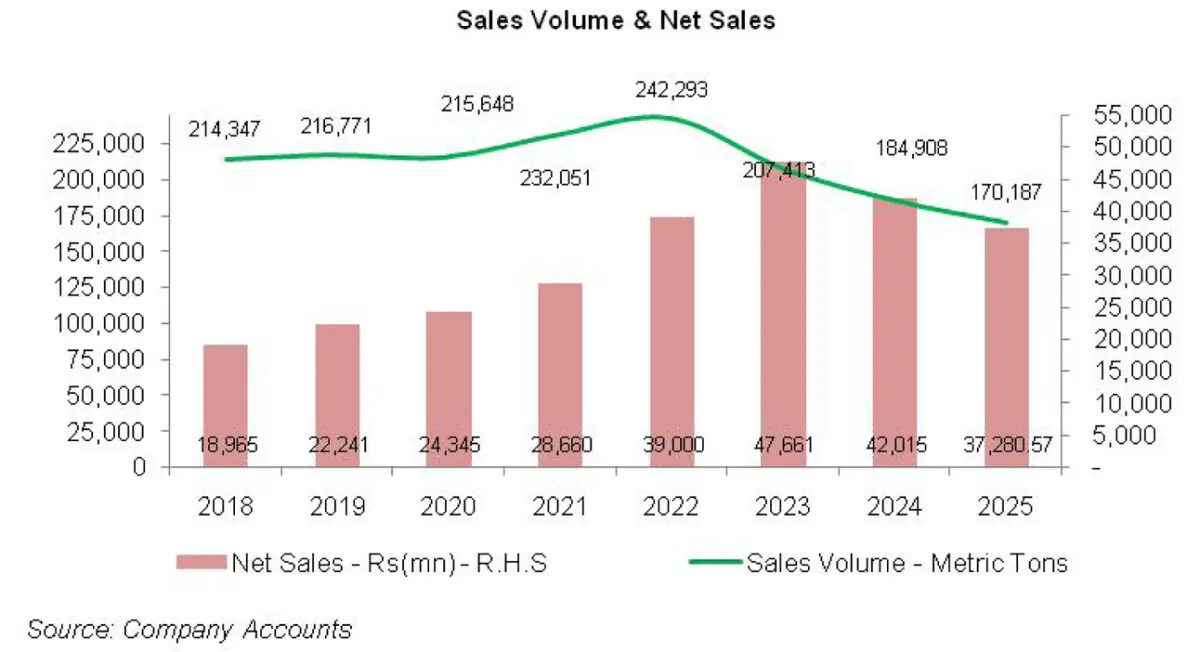
In 2021, CEPB’s net sales grew by 17.72 percent year-on-year to clock in at Rs.28,659.91 million. This came on the back of 7.6 percent year-on-year rise in sales volume. CEPB’s sales volume stood at 232,051 MT in 2021 as consumers started focusing towards packaged products and online shopping after COVID-19 which increased the demand of packaging products in 2021.
However, the demand of writing/printing papers significantly dropped in 2021 due to recurring lockdowns.
CEPB’s export sales also almost doubled in 2021. Gross profit grew by 44.69 percent year-on-year in 2021 due to increased sales volume, operational efficiency, optimal sourcing of raw material and low fuel cost in 2021. GP margin also tremendously grew to attain its highest level of 19.87 percent in 2021. This was against the GP margin of 16.17 percent recorded in 2020.
Administrative and distribution expenses rose by 11 percent and 22.91 percent respectively in 2021. The main drivers were elevated payroll expense and freight outward. Other expense staggeringly grew by 122.29 percent year-on-year in 2021 on account of higher provisioning done for WWF, WPPF and also because of provision booked for expected credit losses in 2021.
Other income also posted a handsome 76.58 percent year-on-year growth from scrap sales proceeds and also because of gain on extinguishment of GIDC liability, gain on insurance claims, government grants as well as gain on sale of operating fixed assets in 2021.
Operating profit grew by 48 percent year-on-year in 2021 with OP margin climbing up to 16.23 percent from 12.91 percent in the previous year. Finance cost shrank by 58.87 percent year-on-year in 2021 on the back of low discount rate and lesser working capital related borrowings.
CEPB’s bottomline posted a stunning 94.49 percent year-on-year growth in 2021 to clock in at Rs.2959.66 million. This translated into NP margin of 10.33 percent in 2021 versus 6.25 percent in 2020. EPS also grew from Rs.10.35 in 2020 to Rs.14.59 in 2021.
CEPB registered 4.4 percent year-on-year growth in its sales volume in 2022 due to impressive growth posted by LSM which created demand for paper and paperboard products. This culminated into topline growth of 36 percent year-on-year in 2022.
CEPB’s net sales were recorded at Rs.39,000.25 million in 2022. While local market performed exceptionally well in terms of sales, export sales dropped by 71 percent year-on-year in 2022 to clock in at just Rs. 41 million which included sales to Afghanistan.
Commodity super cycle in the international market on the back of Russia-Ukraine crisis coupled with Pak Rupee depreciation and high indigenous inflation jacked the cost of sales up by 48.17 percent year-on-year in 2022.
This trimmed down gross profit by 12.68 percent year-on-year in 2022 with GP margin sliding down to 12.75 percent in 2022.
Administrative and distribution expenses posted 18.42 percent and 14.16 percent year-on-year growth respectively on the back of high inflation, induction of human resources to cater high demand and also because of higher outward freight.
Other expense slipped by 32.96 percent year-on-year while other income posted a marginal 3 percent year-on-year growth in 2022. This trimmed down the operating profit by 15.46 percent year-on-year while OP margin ticked down to 10.1 percent in 2022.
Finance cost posted a significant growth of 66.59 percent in 2022 due to high discount rate coupled with increased working capital requirements which drove up the short-term borrowings. Due to supply chain shocks on the back of Russia-Ukraine crisis, the company maintained excess stock of imported inventory which required excess funds.
Moreover, the company also borrowed under TERF facility to finance its Balancing, Modernization & Replacement (BMR) projects. Net profit dropped by 25.26 percent year-on-year in 2022 to clock in at Rs.2211.921 million with NP margin of 5.67 percent. EPS also nosedived to Rs.10.9 in 2022.
In 2023, CEPB’s topline posted 22.21 percent year-on-year growth to clock in at Rs.47,66125 million. Sales volume dropped by 14.4 percent year-on-year to clock in at 207,413 MT. To cope up with the supply side constraints on the back of import restrictions and also due to shutdown of machine to facilitate BMR projects, CEPB rationalized its sales mix to include the products with competitive prices to cope up with constant increase in cost of raw materials and fuel.
Despite rigorous efforts, high cost of sales on the back of elevated raw material prices, Pak Rupee depreciation, high inflation and energy charges didn’t allow CEPB to sustain its gross profit which declined by 10.69 percent year-on-year in 2023. CEPB’s GP margin moved down to its lowest level of 9.32 percent in 2023.
Administrative and distribution expenses posted year-on-year growth of 22 percent and 16.81 percent respectively in 2023. This was on account of higher payroll expense and freight outward. Due to lower profitability, the company booked lesser provision for WWF and WPPF. This drove down other expense by 51.47 percent year-on-year in 2023.
Other income grew by 46.75 percent in 2023 primarily on account scrap sales and amortization of government grant. Operating profit shriveled by 12.61 percent year-on-year in 2023 with OP margin diving down to 7.21 percent. Finance cost multiplied by a massive 198 percent in 2023 due to combined effect of higher discount rate, high working capital requirements and high long-term borrowings to finance BMR projects.
The result was a bottomline slide of 59 percent year-on-year in 2023. CEPB’s net profit clocked in at Rs.904.989 million in 2023 with NP margin of 1.90 percent and EPS of Rs.2.25.
In 2024, CEPB registered 11.85 percent year-on-year decline in its net sales which clocked in at Rs.42,015.48 million. Sales volume eroded by 10.85 percent to clock in at 184,908 MT. Capacity utilization stood at 68 percent in 2024 versus capacity utilization of 74 percent recorded in the previous year. This was on account of sluggish demand, stiff competition from cheaper imported products and unorganized sector as well as outsourcing of some raw materials for corrugated boxes.
BMR of paper & board machines, cogeneration machines and related auxiliaries resulted in operational efficiency. This coupled with reduction in energy cost due to lower coal prices, stable prices of imported raw materials and gas procurement at concessional rates allowed the company to record a slightly higher GP margin of 9.68 percent in 2024.
This was despite 8.46 percent drop in gross profit in absolute terms. Administrative and distribution expenses grew by 13.23 percent and 3 percent respectively in 2024 on the back of adjustment in salaries & wages, higher freight charges and also because of elevated level of inflation.
During the year, CEPB squeezed its workforce to 1605 employees. Other expense tumbled by 12.95 percent in 2024 due to lower profit related provisioning, no exchange loss incurred during the year and no provisioning done for ECL. Other income multiplied by 23.59 percent in 2024 due to increased profit recognized on bank deposits and mutual funds, exchange gain as well as amortization of government grant recorded during the year.
CEPB’s operating profit slid by 12.10 percent in 2024 with OP margin inching down to 7.19 percent. Despite high discount rate, CEPB was able to cut down its finance cost by 8.32 percent in 2024. This was on account of lower outstanding borrowings during the year.
The company kept a strict check on its inventory level and trade receivables which resulted in improved liquidity. CEPB’s net profit slumped by 42.11 percent to clock in at Rs.523.893 million. This translated into EPS of Rs.1.3 and NP margin of 1.25 percent.
In 2025, CEPB recorded 11.27 percent year-on-year dip in its net sales which clocked in at Rs.37,280.57 million. This came on the back of 7.96 percent year-on-year drop in sales volume which clocked in at 170,187 MT. Reduced sales volume was the result of lower demand and tough competition from cheaper imported products particularly coated bleached board (CBB).
Not only did the volume slide in 2025, CEPB also had to reduce the prices of its products by 4 percent to stay relevant in the market.
In line with the reduced demand, the company performed targeted production and outsourced materials for corrugated box production. This resulted in 34.49 percent diminution in gross profit in 2025 with GP margin inching down to 7.14 percent. Administrative and distribution expenses ticked up by 7.88 percent and 10.87 percent respectively in 2025 due to inflationary pressure.
CEPB incurred higher payroll expense despite restructuring of its workforce. Lower profit related provisioning resulted in 66.88 percent dip in other expense in 2025. Other income mounted by 25.91 percent in 2025 and offset the other expense.
Superior other income was due to profit recognized from investments and from the sale of its fixed assets. CEPB recorded 44.46 percent dip in its operating profit in 2025 with OP margin clocking in at 4.50 percent.
Finance cost dipped by 10.80 percent in 2025 due to lower discount rate, the effect of which was partially offset by increased working capital requirements. The company posted net loss of Rs.345.422 million in 2025 which translated into loss per share of Rs.0.86.
Recent Performance (2026)
In 2026, CEPB’s net sales inched up by 3.81 percent to clock in at Rs.38,699.44 million. Market activity and demand improved during the year, resulting in higher production and sales volume. Increased capacity utilization yielded energy efficiency and cost competitiveness for the major part of the year except for the last quarter where higher fuel cost and elevated raw material prices in the consequence of the Middle East crisis wreaked havoc on the overall cost of sales. Gross profit ticked down by 4.15 percent in 2026 with GP margin registering its lowest level of 6.60 percent.
Administrative expense surged by 6.56 percent in 2026 due to inflationary pressure. Conversely, distribution expense dipped by 8.32 percent in 2026 likely due to lower sales volume particularly export sales due to the closure of the Afghan border. Other expense escalated by 122.74 percent in 2026 seemingly due to exchange loss.
Other expense was offset by 61.30 percent stronger other income recorded in 2026 which appears to be the consequence of gain recognized from the sale of short-term investments.
Operating profit improved by 3.65 percent in 2026 with OP margin staying intact at 4.50 percent. Finance cost plummeted by 25.68 percent in 2025 due to monetary easing for most part of the year. This was despite increased short-term and long-term loans outstanding at the end of the year.
While profit-before-tax staggering grew by 1612.47 percent in 2026 to clock in at Rs.514.391 million, adjustments in the recognition of deferred tax assets associated with adjustable turnover tax balances resulted in net loss of Rs.58.293 million in 2026, down 83.12 percent year-on-year. This translated into loss per share of Rs.0.15 in 2026.
Future Outlook
FMCG sector is showcasing improved demand particularly in the food, beverages, and tobacco segments.
However, ongoing crisis in the Middle East has taken its toll on the prices of fuel and other essential raw materials. Higher working capital requirements and the reversal of the monetary easing cycle may also exert pressure on the financial performance of CEPB in the coming times.















Comments