


BR Research: Pakistan’s power curve has bent – policy hasn’t, yet

Electricity demand and generation patterns aren’t supposed to transform dramatically within just two years. Yet the hourly profiles for September 2025 versus September 2023 reveal a power system undergoing rapid, bottom-up change — one driven less by central planning and more by the uncoordinated surge of rooftop solar and shifting industrial behavior.
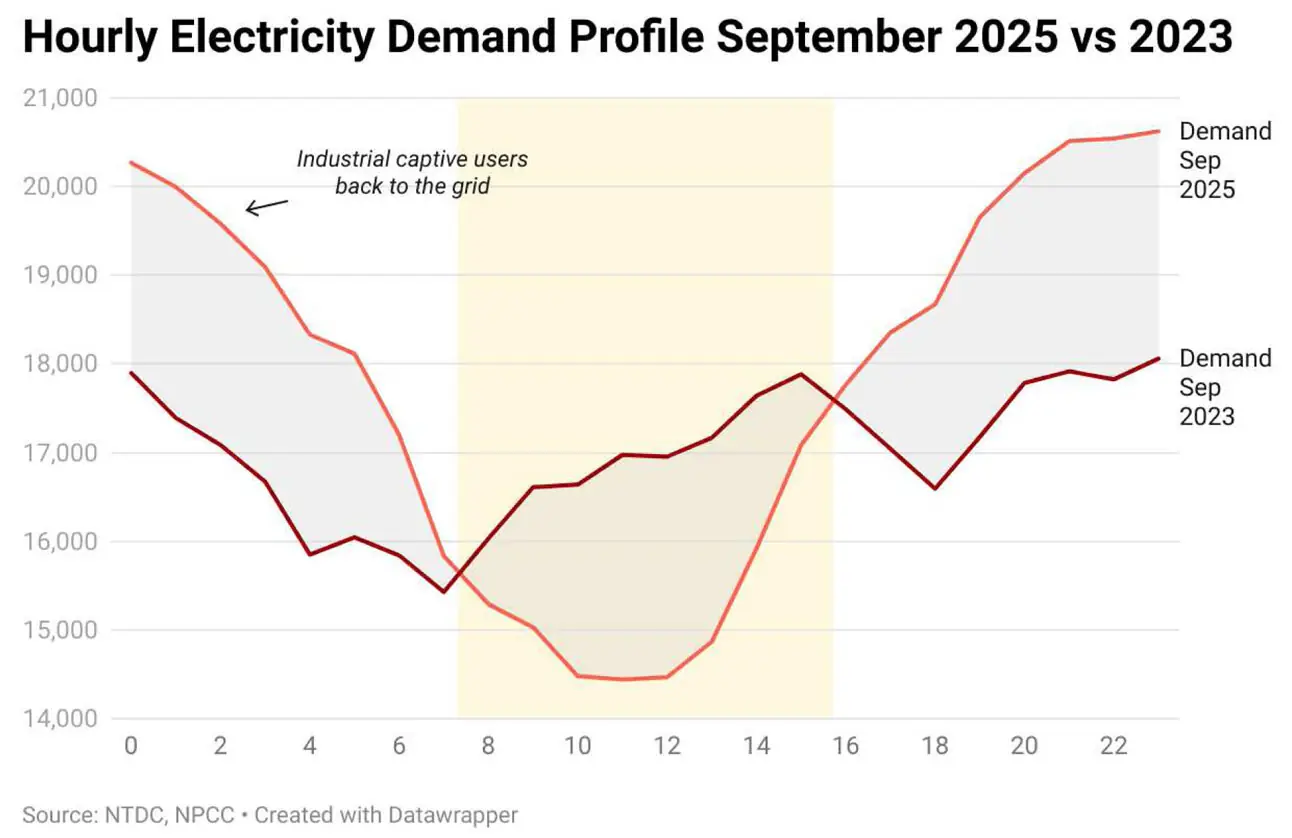
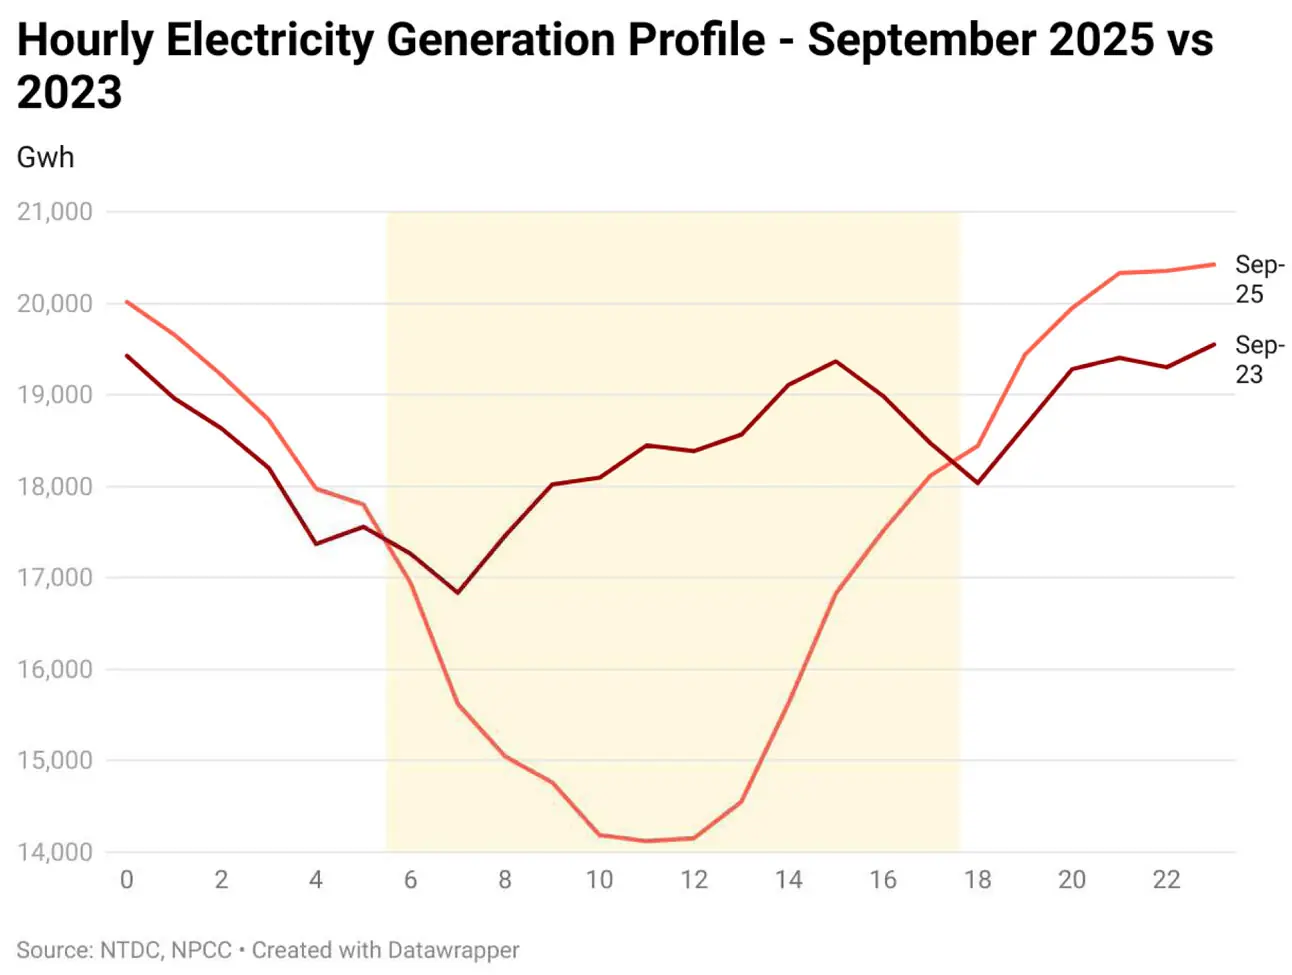
The contrast between the two years is unmistakable. What was once a smooth, balanced curve has turned into a deep midday valley followed by a sharp evening climb. Both demand and generation dip steeply between hours 9 and 14, bottoming out near 14,000 GWh — roughly 3,000 GWh below comparable 2023 levels — before rebounding above 20,000 GWh in the evening.
This is the unmistakable imprint of solar power: when the sun is high, self-generation peaks and grid demand collapses; as the sun sets, consumers return en masse, forcing the system to ramp up costly thermal plants at short notice.
The shift is structural, not seasonal. The generation curve mirrors the same pattern, revealing how midday solar output is crowding out conventional supply before an evening scramble to meet surging demand.
The data also hints at another layer of change — the partial return of industrial captive users to the grid. The early-morning uptick in demand suggests that some industries, facing high fuel costs or supply constraints, are now drawing more power from the system.
The result is a grid grappling with both reduced daytime load and intensified evening stress — a volatility it was never designed to handle.
For policymakers, the implications are profound. Pakistan’s planning and forecasting models still revolve around annual demand growth and static capacity targets. But as the latest hourly data shows, the real challenge is no longer how much power the country needs — it’s when that power is needed. A system built around baseload plants is now facing the classic “duck curve,” where solar’s rise creates midday surpluses and evening shortfalls.
The priority now must shift to flexibility: fast-ramping plants, battery storage, and demand-side management tools that can smooth the peaks and troughs. Equally urgent is a rethink of the net metering framework. What began as a welcome incentive for adoption has, in its unchecked form, started distorting costs.
Without rationalization, the burden of balancing evening demand will increasingly fall on non-solar consumers, deepening inequities and fiscal stress in a sector already weighed down by circular debt.
Net metered purchase by the CPPA in nine months of 2025 at 1.4 billion units has trebled from a year ago. Some estimates now put, behind-the-meter and off-grid capacities touching 35 GW – with over 50 GW already imported in.
Pakistan’s energy transition is unfolding faster than official forecasts or regulatory frameworks can keep up with. If planning continues to look backward, the grid will become increasingly mismatched to reality: oversupplied in daylight, strained after sunset, and perpetually short of cash.
The power curve has already bent. Whether policy bends with it — toward flexibility, foresight, and fairness — will determine if this transition brings stability or yet another imbalance to Pakistan’s energy future.























Comments
Comments are closed for this article.