




October 2022 marked the fifth month in a row, where electricity generation went down year-on-year. Even peak Covid saw the generation go down for no more than three months at a stretch. This is now in FY19 territory, where the economic slowdown led to negligible GDP growth, largely towards the end of fiscal year. Never before or since, has power generation stayed low year-on-year for such a long stretch.

Before the pattern emerged, power generation had been growing steadily for 24 straight months, averaging 9 percent year-on-year – much-in-line with trailing 10-year average. On a 12-month moving average basis, the growth is down to 2.47 percent, having stayed north of 10 percent between November 2021 to June 2022. The graph clearly tells the dip is sharper than the previous two seen during peak Covid and the slowdown of FY19.
The LSM data comes with a lag and sits in sync with the electricity generation pattern – the dip for both starting around the same time. Industrial consumption constitutes around 25 percent of the total. Domestic demand has been found to stick around at most times. Although, there could have been a case of lower demand from the domestic sector, the bulk is believed to have come from industrial side. Mind you, the government had pinned his hopes of the revival of the energy sector on increased consumption, driven primarily by the industrial sector. Reduced off-take from industries hits the sector in many ways – as industries are often the best consumers paying in full and an on time. Reduced industrial share spells more trouble.
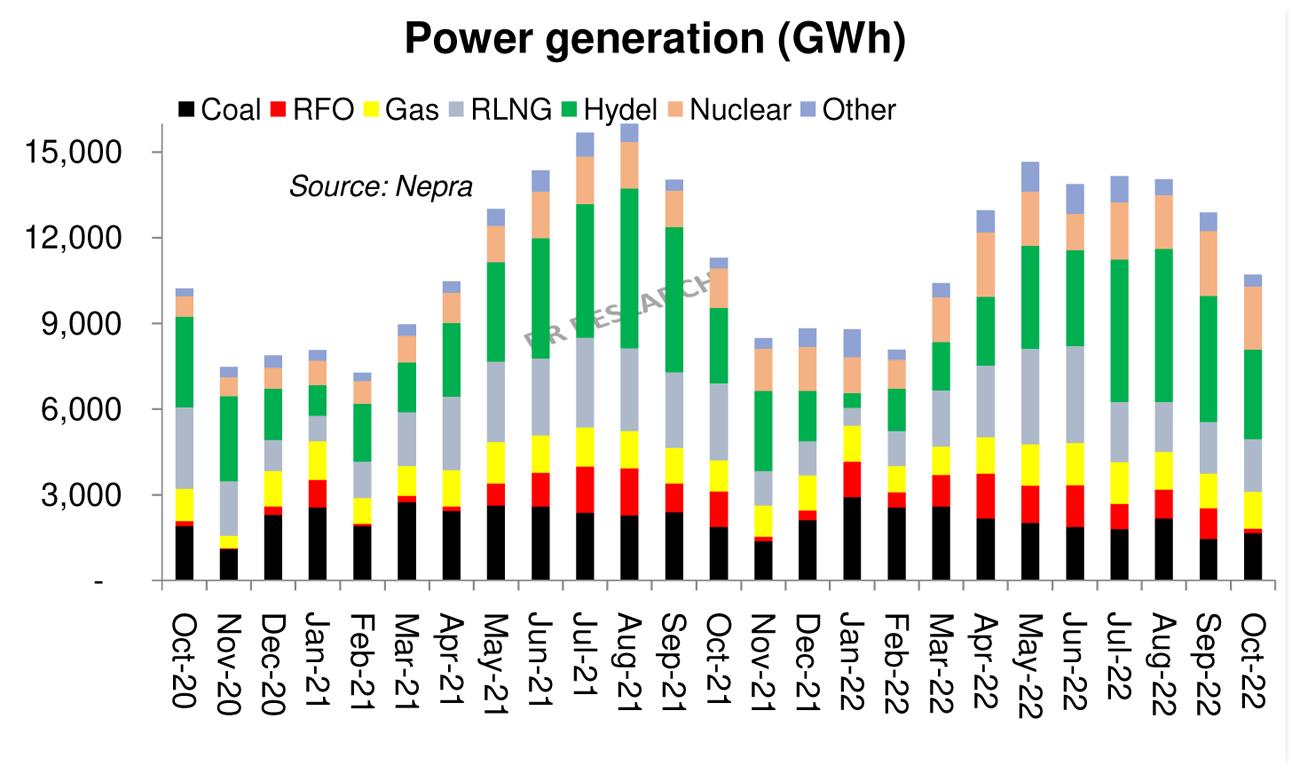
As reference furl tariffs have been doubled in most cases, the monthly fuel adjustments have come down significantly. Capacity charges will remain elevated as fuel shortages are almost a certainty during peak winters. On the bright side, nuclear share in power generation has increased steadily, with October 2022 marking the highest monthly share ever at 21 percent. The broader picture remains largely unchanged, i.e. abysmal. Nothing concrete beyond tariff rationalization has taken place. Losses remain high, recoveries remain low. Expecting the circular debt flow to stem beyond immediate term would be foolish.

























Comments
Comments are closed for this article.