China's commodity demand holds up, with copper the exception

LAUNCESTON: One of the prevailing China narratives in commodity markets is that the trade dispute with the United States is weakening demand in the world's biggest importer of natural resources. The problem is the numbers tell a somewhat different story.
While the overall economy may be feeling strain, with gross domestic product growth slipping to 6.2% in the second quarter from 6.4% in the first, demand for commodities has held up remarkably well.
China's June customs data saw month-on-month declines in imports of copper, coal, iron ore and crude oil, helping to feed the view that demand for major commodities is softening.
But taking a one-month only view is risky and in this case somewhat misleading.
For example, while crude imports dropped 1.6% in June from May, on a tonnes basis, on the more important barrels per day (bpd) measure they actually increased 1.7% as May has one more day than June.
The drop in coal imports was a tiny 370,000 tonnes, meaning that on a tonnes per day basis imports were actually higher in June.
Iron ore imports were 10.2% weaker in June from May, and this can mostly be explained by the struggles of China's second-biggest exporter Brazil to recover from mine closures in the wake of fatal dam collapse in January.
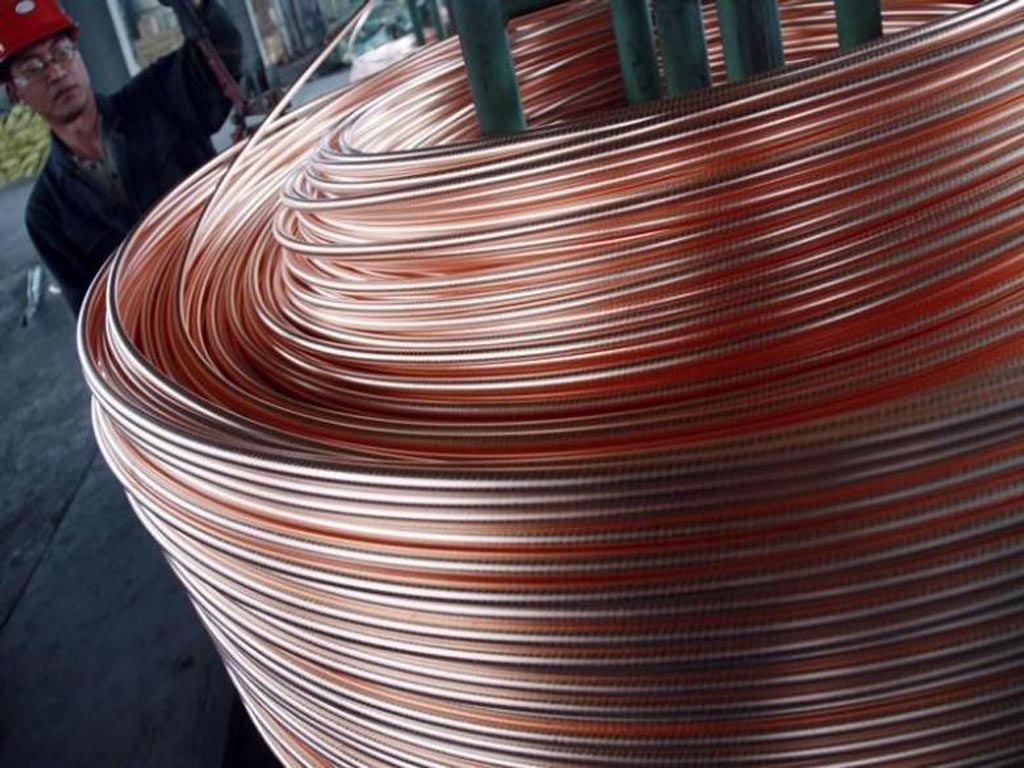
Copper was the major commodity that looks the weakest, with imports of unwrought copper dropping 9.7% in June from May, and ores and concentrates slumping 20.4%.
A shortage of ores and concentrates on the global markets may explain some of the decline in the imports of this raw copper material, but lack of demand in manufacturing is the most likely culprit for the drop in unwrought imports.
Moving from a month-to-month view of the trade figures to quarter-by-quarter confirms the downbeat view for copper, with second quarter imports of unwrought copper dropping to 1.092 million tonnes, a 7.5% decline from the first quarter and some 20% below the second quarter of last year.
If there is evidence in commodities for the deleterious effect of the trade dispute, copper is it, given the metal's widespread use in manufacturing in China's vast export sector.
RESILIENT COMMODITY DEMAND
But outside of copper it's a somewhat different story.
Crude oil imports actually accelerated in the second quarter from the first, reaching 9.9 million bpd in the April-June period, up from 9.83 million bpd in the January-March period. They were also up substantially from the 9.04 million bpd in the second quarter of 2018.
It's likely that imports were boosted by flows into strategic and commercial storage, and there is a chance that these will ease in the second half, but for the moment China remains the engine of global oil demand growth.
Coal imports also accelerated in the second quarter from the first, reaching 79.86 million tonnes, up 7% from the first quarter's 74.63 million.
Increasing coal imports came about despite concerns over slower customs processing on shipments from Australia and moves to boost domestic coal supplies.
Iron ore imports were weaker in the second quarter, but this can mostly be attributed to the slump in shipments from Brazil after the dam collapse, and weakness in April from Australia after a tropical cyclone struck the main producing region in late March.
The 8.6% drop in iron ore imports from the first to the second quarter may be more than just the supply issues, but there is little evidence that steel production is slowing.
June's steel output was 87.53 million tonnes, down from 89.09 million in May, but higher at 2.92 million tonnes per day, compared to May's 2.87 million.
June's daily steel output is a record high, and output is also 10% higher in the first half from the same period in 2018.
Overall, China's major commodity imports are showing a fair degree of resilience, with only copper being weak.
Watching demand for the industrial metal will become key in the second half to assess whether China is indeed successfully managing the fallout from the trade dispute with the United States, or whether stimulus measures are just papering over ever widening cracks.


Comments
Comments are closed.