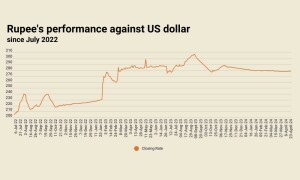
 Significant currency depreciation in FY19 lifted the oil and gas exploration and production sector’s earnings in that year including that of Pakistan Petroleum Limited (PSX:PPL). PPL’s revenues grew not only due to crude oil prices but also the indexation factor in all quarters of FY19.
First OGDCL and now PPL – both have posted flat earnings growth in 1QFY20. PPL’s revenues increased by over 9 percent year-on-year in the first quarter of FY20. Where the volumetric growth was missing, the growth in the company’s topline can once again be attributed to the increase in indexation factor while the realised price of crude oil declined during the period. The decline in volumes was largely due to natural decline from maturing fields and lower offtake by SNGPL during July and August 2019 due to load management issues arising from the import of LNG.
| Pakistan Petroleum Limited (unconsolidated) | |||
| Rs (mn) | 1QFY20 | 1QFY19 | YoY |
| Net sales | 41,759 | 38,217 | 9.3% |
| Operating expenses | 9,211 | 9,086 | 1.4% |
| Royalties and other levies | 6,140 | 5,637 | 8.9% |
| Gross Profit | 26,409 | 23,493 | 12.4% |
| Exploration expense | 2,864 | 3,187 | -10.1% |
| Administrative expenses | 612 | 530 | 15.4% |
| Finance costs | 271 | 134 | 102.4% |
| Other charges | 4,357 | 2,100 | 107.4% |
| Other income | 882 | 1,985 | -55.6% |
| Profit before tax | 19,187 | 19,527 | -1.7% |
| Taxation | 4,949 | 5,338 | -7.3% |
| Profit after tax | 14,237 | 14,189 | 0.3% |
| EPS (Rs) | 6.28 | 6.26 | 0.3% |
| Gross margins | 63.2% | 61.5% | 1.77% |
| Net margins | 34.1% | 37.1% | -3.03% |
| Source:PSX | |||
PPL’s earnings in 1QFY20 remained flat despite a 12 percent eyar-on-year growth in gross profit as other charges doubled and other income slipped by more than half during 1QFY20 on a year-on-year basis. According to the the Director’s report, the decline in other income and the increase in other charges stemmed from exhange lossesin the current period as compared to exchangegaisn in the previous corresponding period and impairment loss on investment in PPL Asia in 1QFY20 versus a reversal of impairment on investment in PPL Europe in 1QFY19.


Comments
Comments are closed.