

Pakistan has been a net importer of raw cotton (HS codes 5200) for a long time. This is not a bad thing for a number of reasons. For one, garment manufacturers tirelessly make efforts to position ourselves as a hub of value-added segment. If that means importing higher quality cotton to meet buyers’ requirements, then so be it, as exchange earnings made from value-added are surely to compensate for import of raw material.
Flawed incentive structures for growers also don’t help. In order to ensure that textile exports remain price competitive in global market, it is imperative that domestic cotton prices remain in line with those in global market.
Duty structure on cotton import is also laced, to ensure that in years of drought and poor crop yield, the export sector does not suffer from raw material shortage.
In this backdrop, it is not necessarily worrying if domestic net import of cotton is increasing. After all, top apparel exporting nations such as China, Bangladesh, Vietnam and India are net importers of raw cotton too.

However, the story doesn’t quite add up when increasing raw material import doesn’t quite fully translate into growing value-added export, which has been the bane of textile industry for the past five years. Talk to textile player of any size and they blame the previous government’s ill-informed policy to holding off US rupee depreciation and, rightly so. For almost three years, textile exporter failed to keep up margins due to overvalued rupee. But if exports weren’t increasing, how did raw cotton import quantity managed to keep growing?

For one, the collapse of cotton price post FY12 in the global commodity market meant that the value-added sector could afford to import higher quality cotton from places such as Brazil and USA. During this period, per ton price of cotton declined from the peak of $3,500 in FY11, bottoming out in FY16 at $1,536. This was particularly significant in the backdrop of overvalued rupee, which made imports more affordable.
This period also saw consistent decline of raw cotton exports (in value terms) to all major traditional destinations. After peaking at $480 million (HS code 5201) in FY12, raw cotton export declined to one-tenth of the original value, clocking in at just $41million by FY17. While export to China almost came to naught as a result of the ill-conceived FTA, export to India and Bangladesh also came down to near zero.
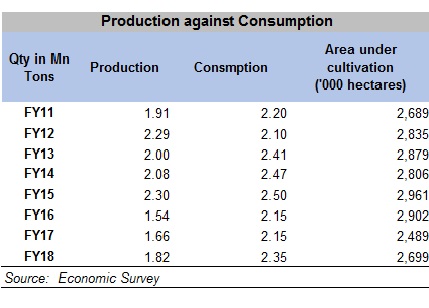
The explanation does not appear to be very complicated. Price of cotton in global commodity market was at historically low levels, which meant that there was little demand for poor quality cotton from Pakistan. As a result, area under cotton cultivation also declined by 14 percent between FY12 and FY17.
So where was all the imported raw cotton was going, if not into exports? Industry analysts point towards increase in higher thread count yarn (HS code: 5205) import during the same period. Read together, analysts opine that overvalued rupee may have inadvertently led to increase cotton and cotton-based yarn import to service consumption of local demand (read lawn sales).


Comments
Comments are closed for this article.