

Of the many problems facing Pakistan economy today, the ever growing trade deficit is one that haunts the policymakers the most. And as oil prices show little signs of going down, the signs of worry appear more visible. There have been suggestions of a recovery of sorts in exports – as oil prices go up - the presumption being that most commodities follow the hydrocarbon prices with or without a lag.
Pakistan’s exports are dominated by textiles. This has been the case for decades – as the textile share in exports has hovered around 60 percent for quite some time. The textile sector make up for four of the top five export sub-sectors. But the correlation of textile related exports price with oil prices is almost non-existent – barring a relatively positive one with cotton yarn.
It is in fact the exchange rate fluctuation that appears to have a higher correlation with export unit price, across sectors. Yes, the sector was faced with a multitude of factors that hindered its growth in the last few years, top of which is the energy crisis.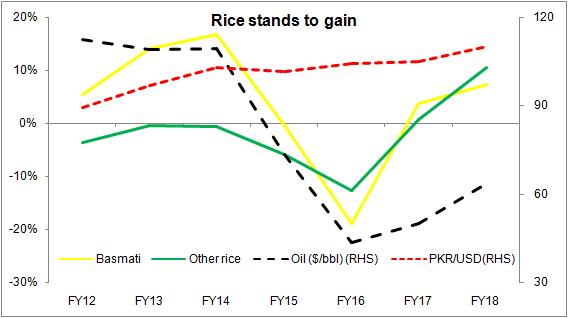
But this is about the unit price movement of textile products – and that fails to show a meaningful correlation with crude oil.There is one exporting sector though, that has showed high correlation with oil price movement, with respect to unit price.
There is ample academic research supporting the strong correlation of rice and hydrocarbon prices. And the graph tells the tale. Share of rice exports has averaged 8.5 percent in the last ten years – where the shift from Basmati being the dominant category to leading the way, is rather well documented.
What is of note is that rice is perhaps the only exporting sector, with a meaningful share, that stands to gain from upwards oil price movement. Average annual growth in terms of quantity of rice exports in the last 5 years has been 4 percent. Considering the oil price end up averaging 20 percent more than last year, the overall impact on unit pricing of rice would be around 5-6 percent, given historical trends.
A 6 percent price increase in a category having 8.5 percent share in exports – promises no more than 1 percent increase in overall exports. Moral of the story is, take no heart from rising oil prices. It stands to hit the trade deficit more than any potential gains.


Comments
Comments are closed for this article.