
Does Pakistan need more Man-Made Fibres (MMF) to grow its share in global apparel exports? Studies conducted by various trade organizations place share of MMF in global textile trade anywhere between 55 to 70 percent. Yet, a comparative analysis of regional exporting countries show that while higher use of MMF can definitely help Pakistan increase its apparel exports, it is not a make-or-break in achieving the pipe dream of $30 billion in textile exports.
To understand the role of MMF and other non-cotton fibres (such as synthetic, artificial, animal, and non-cotton plant-based fibres), BR Research conducted a time series analysis of regional exporters’ performance using trade statistics from International Trade Centre. Bear in mind, the following analysis is restricted to trade value and not volume, as quantity statistics for all countries were either not available, or used varying units (metric tons, versus units in dozens) which rendered volumetric analysis futile. Analysis is based on Product Clusters at 6-digit level, which lists various products ‘by type of fibre’ used in manufacturing.
Based on ITC data, annual global apparel trade (HS Code Chapters 61 and 62) has averaged close to $450 billion per annum for the past five years. Of this, 42 percent consists of apparels – both knitted/crocheted as well as woven – made of cotton-based fibres. The remainder 58 percent not only includes man-made fibres, but also other natural fibres such as silk, wool, hemp etc. However, synthetic and artificial fibres have the greatest share of pie, varying between 45 – 48 percent (in value terms!)
But country-wise analysis reveals more startling trends. The three Asian apparel giants – China, Bangladesh, and Viet Nam – that together boast 45 percent share in global apparel exports - have followed different trajectories to unlocking apparel export success.
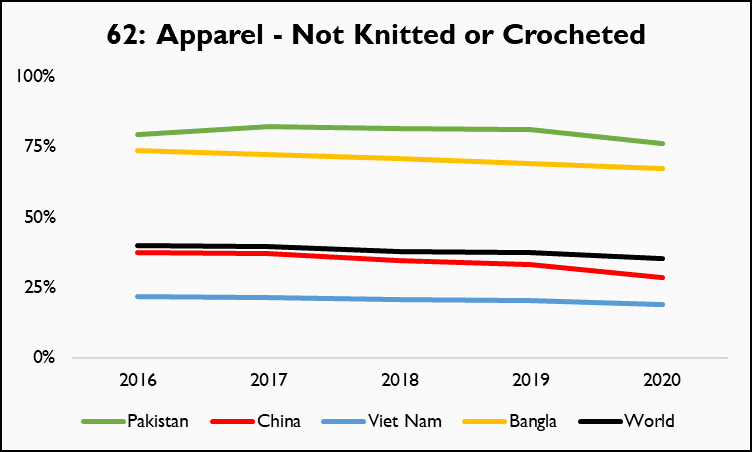
Over the past five years, share of cotton in Viet Nam’s apparel exports has averaged less than 30 percent, while MMF have maintained a lion’s share. It is pertinent to note while Viet Nam’s apparel exports are evenly divided between knitwear (HS Chp. 61) and readymade garments (HS Chp. 62) in value terms, share of cotton fibre is significantly higher in Vietnamese knitwear – nearly 40 percent; and while share of apparel made-of cotton fibre in non-knitted garments is less than 20 percent!
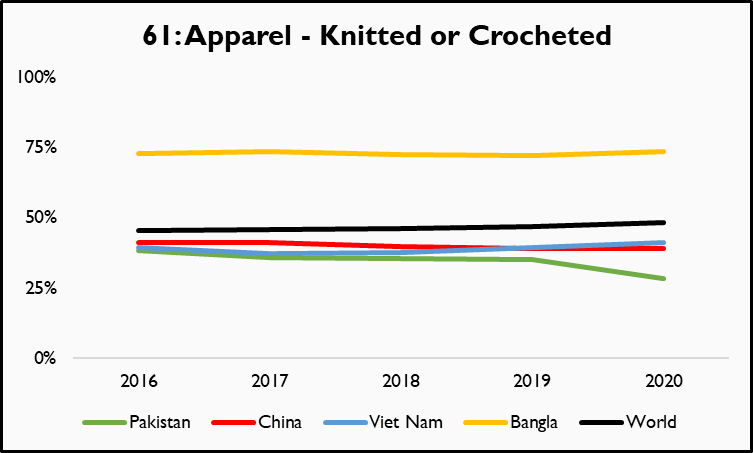
The case of Bangladesh is even more stark! Just like Viet Nam, apparel exports are neatly divided between knitwear and non-knitwear garments, each with a share of $19 billion per annum. But surprisingly, share of apparel made of cotton-based fibres in Bangladesh’s exports is significantly high! During the last five years, share of cotton-fibres exceeded 70 percent within Bangladesh’s apparel exports, averaging 75 percent for apparel in the knitwear category.
Back home, comparison to global trends makes little intuitive sense, if not altogether comical. In line with other regional exporters, Pakistan’s apparel exports are also evenly divided between knitwear and woven garments (albeit with a slight tilt towards knitwear, 52-48) in value terms. Share of cotton-based fibres in knitwear exports averages under 35 percent for Pakistan, which is lowest among the group of countries selected! Yet, higher use of MMF by Pakistani knitwear manufacturers has certainly not helped the country grow its share in world market, which averaged at 1.2 percent, compared to 6 and 9 percent for Viet Nam and Bangladesh, respectively.
In sharp contrast, share of cotton-based fibres in Pakistan’s woven and other non-knitwear garments averaged at over 80 percent during the past 5 years, possibly highest in the world. Although higher share of cotton-based garments is understandable (due to higher share of cotton-based denim garments in Pakistan’s readymade garment exports). But it comes as little surprise that Pakistan’s share in global trade of non-knitted garments is also abysmally low (in value terms), averaging at 1.1 percent during the period under review.
Of course, there is little denying that global textile mix is shifting towards man-made fibres, with share of cotton-fibres observing a secular decline over the past century. However, as the exponential growth of Bangladesh’s apparel exports over the past two decades show, MMF is certainly not the only route to success in global trade; which is even more remarkable for a country with little to no indigenous production of cotton.


Comments
Comments are closed.