

The current account is clearly slipping. The deficit stood at $1.5 billion in August 2021, and the number is $2.3 billion for 2MFY21 as compared to a surplus of $838 million during the same period last year. The sharp change is due to economic inertia during pandemic, from commodity prices touching bottom to charting fresh peaks in CY21. Economy is burning away the surplus it had gained last year, ironing out back to its average. Nonetheless, a return of current account deficit to manageable range of 2-3 percent seems elusive (unless commodity prices decline).
The key concern is rising imports, which stood at $6 billion in Aug 2021 – average monthly imports of last three months stood at $5.9 billion. This $800 million higher than average monthly imports during May-July 2018, which left the country in the throes of a BoP crisis. Back then, economy faced overheating whereas in 2021 economy it is still in a lukewarm phase. The difference is higher commodity prices, growth, pressure of COVID vaccines, and TERF imports.
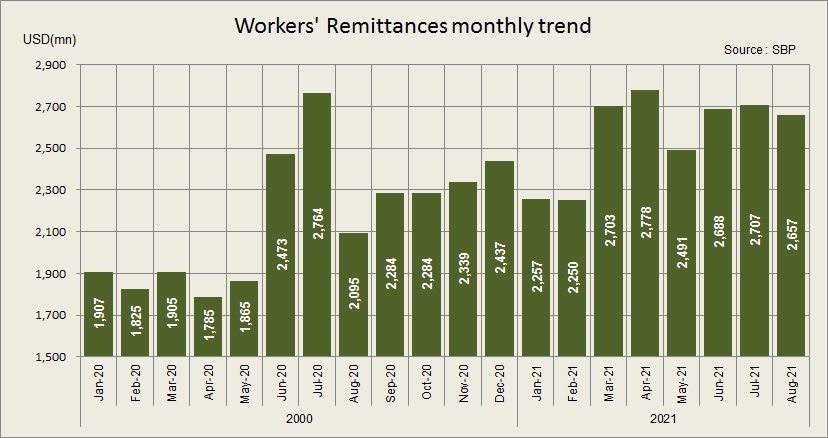
Exports, on the other hand, stood at just $2.35 billion in Aug 2021. The real gain is coming from remittances which came at $2.7 billion in Aug-21 and have remained consistently high. For example, the average toll was $1.8 billion when imports were peaking in 2018. The increase in remittances have more than compensated the increase in imports. Plus, there is some growth in exports and fall in services trade deficit.

That is why current account deficit is still lower in absolute numbers from its past peak deficit. The CAD monthly average stood at $1.3 billion in Jun-Aug21 vs $2.1 billion in May-Jul18. The key is to maintain the remittances upbeat momentum along with some curb in imports while exports will take their sweet time to grow.
The challenge on remittances is re-opening of travel. Last year, the current account surplus was primarily due to less travel. For details read “Demystifying the current account surplus”, published on 20th Nov 2020. With less travel, informal channel remittances started coming from formal channels. With less travel, there was low (or no) demand of foreign currency for travelers, and there was less expense on ticketing and other boarding and lodging expenses. With less travel, the international oil prices were low.

Now the tables are turning. The oil and other commodity prices have already moved up. The travel from Pakistan is slowly opening. Just recently, Pakistan was taken out of red list for UK visit. UAE is opening too. The bigger impact of travel related outflows will start with opening of Haj/Umrah. The challenge going forward is how to keep remittances high and how to keep services trade balance low.

The other way to look is that in 2020 due to Covid related lockdowns, SBP and federal government came up with multiple economic stimulus. Since lockdowns in Pakistan were significantly shorter than those in many other competing economies, the exports picked up at home. Then the monetary tightening cycle in the country which was supposed to go on (had there been no COVID) has changed 180 degrees. The federal government was struggling to get approval from the IMF on construction package, and Covid let them achieve it. The better support price of wheat spurred rural demand.
Even without travel opening up, the CAD growth will raise alarm bells. It is of utmost importance to put some control on imports to try to bring CAD in the stipulated range of 2-3 percent of GDP in FY22. SBP and government must revisit the expansionary policies. SBP must give signal to end its accommodating monetary policy stance. Federal government must go easy on the growth paddle. FM Shaukat Tarin must revisit his plans to accelerate growth to 6-7 percent. There just aren’t dollars to finance it.
The growth in imports is mainly due to rising commodity prices with some elements of growing demand too. The food imports in Jul-Aug are 45 percent higher than the same period last year to stand at $1.3 billion. The growth in palm oil (40% of food imports) is 62 percent. PBS data tells that the volumes of palm oil imports fell by 13 percent while value is up by 64 percent. This implies that palm oil effective import price is up by 87 percent in Jul-Aug21 as compared to the same period last year. The story of pulses is similar. But here both volumes and values are growing but with average price increase of 31 percent.
The machinery imports are up by 19 percent. This is despite the fact the power machinery (which were major machinery imports in 2018) is on a decline. Then the consumption item (mobile phones) imports fell too by 20 percent. Barring, power machinery and mobile phones, the group imports increased by 59 percent. This is good in a sense as the economic capacity is expanding. In 2017-19, the power projects were coming online and there was machinery imports pressure, and now with adequate energy availability, other sectors are expanding. However, not much expansion could have come had the SBP not offered TERF. Almost half of the TERF went to textile and its machinery imports are up by 208 percent to $219 million in July-Aug21. Other machinery imports are up by 54 percent to $459 million. Here the TERF is playing the role. The impact of TERF related imports shall continue this fiscal year.
There is a massive pick in the transport sector imports. Every month, new models of cars are being launched. The federal government lowered the taxes and duties on both CKD and CBU, and its impact is clearly depicting in numbers. It is not only cars, but imports of buses, trucks and other heavy vehicles are growing in tandem. This is a clear sign of demand picking. The imports are up by 165 percent to $603 billion.

The CBU cars imports stood at $76 million in Jul-Aug which is almost ten times the number in the same period last year. The average monthly imports in Jul-Aug are 2.1 times the average monthly imports of past five years. The scores of imported MG HS, and luxury EVs seen on roads are reflecting in imports number. In case of CKD cars, the Jul-Aug number is up by 182 percent to $237 million. The kits for locally manufacturing cars monthly average import in Jul-Aug21 stands at $118 million which is 1.75 times the average monthly imports in the past five years. Even though the global industry is suffering from chip (semiconductor) shortages, import growth is high. This is evident by the fact that wait time for car deliveries runs in 4-8 months while the booking is closed for some models. What would have been the case, had there been no shortage?
The petroleum group is the biggest sub sector in imports, and the benefit of low oil prices in the last year was reflected here. The number is up by 87 percent in Jul-Aug 21 to $2.4 billion. The growth in petroleum products is up by 80 percent to $1.2 billion. Here the PBS numbers suggest that both price and demand are growing as 16 percent growth in volumes while the value growth is 105 percent suggesting that the price increase impact is 77 percent. Here the government is not passing on the impact of increase in prices to consumer and the consumption growth remained unchecked. This policy needs revisiting. Then the LNG imports are up by 219 percent to $508 million in Jul-Aug21, and its due to importing at top dollars.
The story of the rest of imports is similar where the combination of partial growth in volumes and steep increase in prices are resulting in high imports growth. Then there are some new elements in it. One is wheat which is supposed to be one-off last year, but the imports are taking place this year as well. Wheat imports are likely to not continue next year. Then TERF scheme has imports of around $3 billion – 30 percent had been paid in advance, and now remaining is being paid as shipments arrive – the net monthly impact of $150-200 million will continue this year. Third element is COVID where vaccination imports commitment is around $1.5 billion and will be spread over few quarters with $100-150 million imports a month. By next year, these three elements will not be there, and hopefully commodity prices would revert to mean. This means the country has one tough year to handle, and the CAD should be controlled to not let the crisis to go out of control, as in the past, the country has experienced that one year of high unchecked current account deficit takes a few years to normalize. The good news is from next year exports may grow as new capacities in the exporting industry – mainly in textile, will come online. The exports in Jul-Aug stood at $4.6 billion and this would translate into annualized exports of $27.6 billion. This number is better than past where $25 billion was peaking number. Still seeing the imports growth, this is getting relatively smaller.

The exports in services are moving up. Thanks to better performance of technology exports – these are up by 46 percent to $420 million in Jul-Aug, and it’s a second year of high growth. At this pace technology exports will reach $2.5 billion this year. Still the number is too low. On the flipside, import services are growing again- up by 31 percent to $1.6 billion in Jul-Aug21. The decline was directly linked to low goods imports and less travel.
Remittances are still growing – up by 10 percent to $5.4 billion. But its challenging to keep this pace as mentioned above with travel opening up across the world. The slowdown is already visible in other current transfer – charity and donations, where the Jul-Aug21 numbers are down by 53 percent to $370 million.
The bottom line is that without checking the demand at high prices, the imports would not come down and the current account deficit will remain at worrisome levels. There are signs of demand picking in sectors like construction, automobile, and others; but still in some cases the demand is yet to reach the 2018 peak levels. But imports are higher, and current account is slipping. Coordinated fiscal and monetary side efforts are required to control the deficit.


Comments
Comments are closed.