

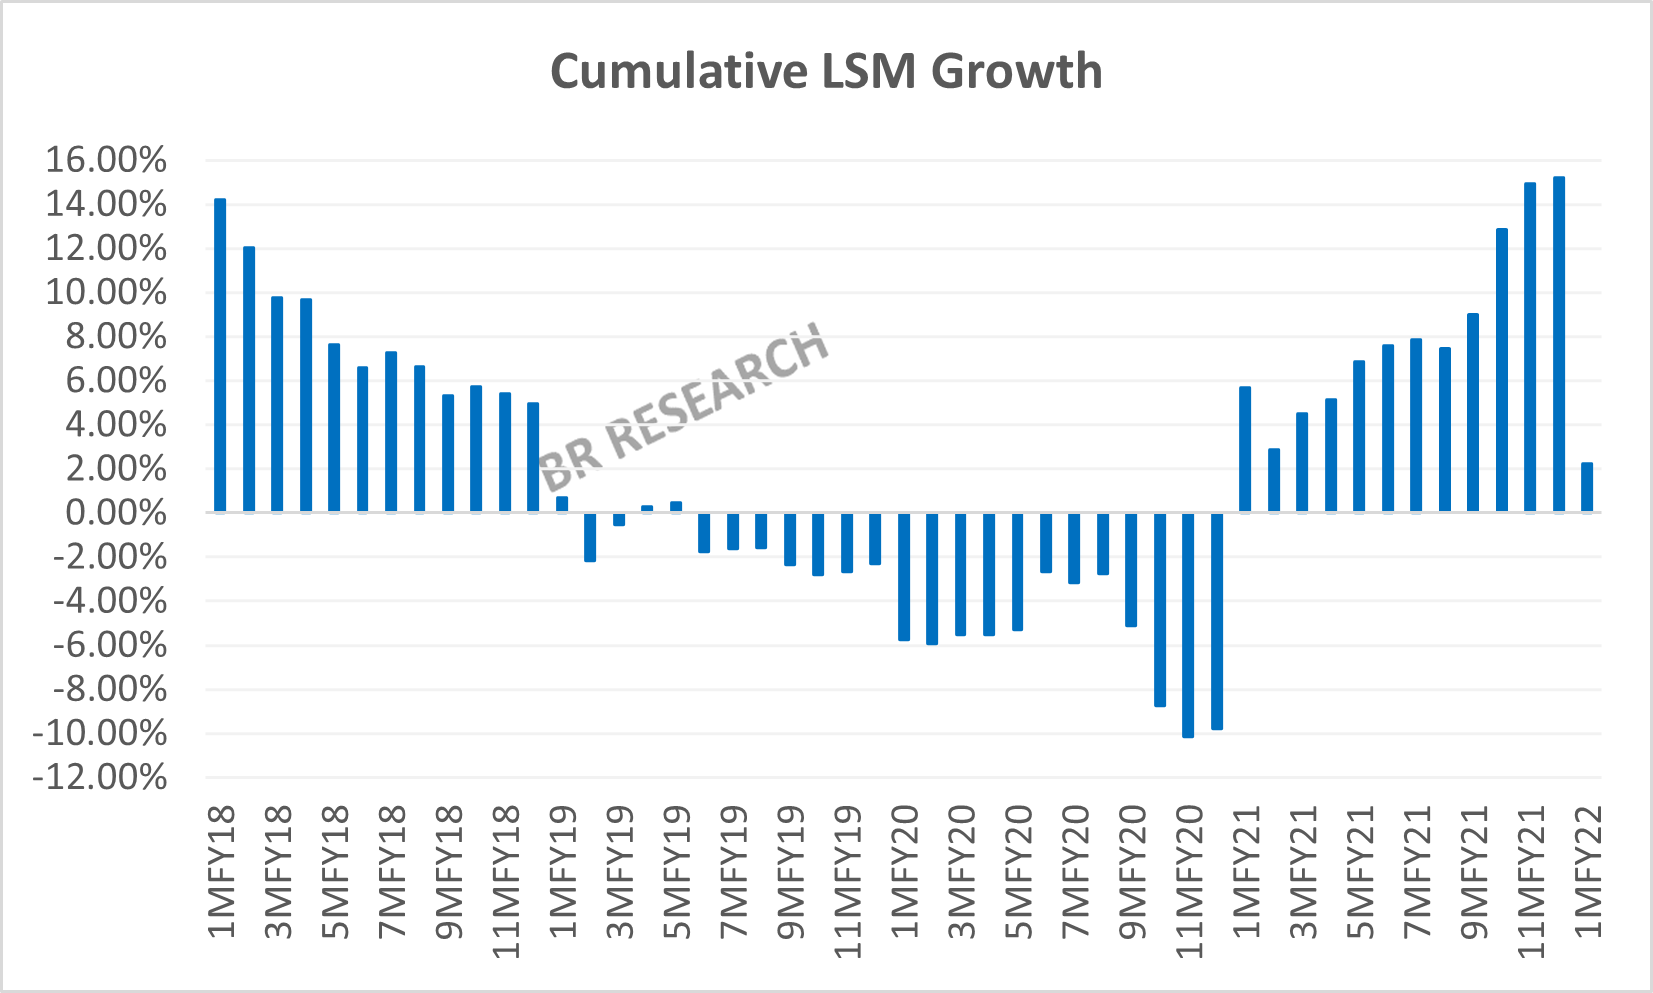
Large-Scale Manufacturing (LSM) growth at 2.25 percent for June 2021 put brakes on the double-digit growth reported for six of the last eight months. Of course, the low base is gradually moving out of play – and in case of July 2021, the reverse may actually be true. Recall that back in July 2020, Pakistan had no commercial or industrial restrictions in place. In contrast, July 2021 did see various degrees of restricted activities across different parts of the country.
That said, the index value of 138 achieved for July 2021 is the highest ever – even though beating the 5-year monthly average index value by a little under 4 percentage points. Existence and extent of organic LSM growth is difficult to gauge in the current scenario, where the next partial lockdown is always another Greek alphabet named variant away. There is only so much one can make of the growth percentages in a scenario where base effect keeps switching positions. That is where a look at overall production numbers, especially the non-cyclical production, helps.
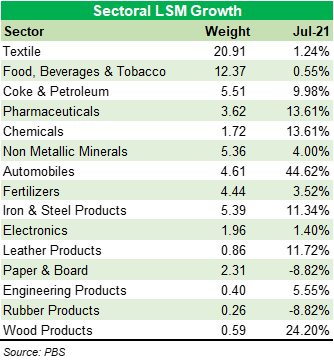
More items have posted year-on-year production decline than was witnessed in any of the last six months. Forty three of the 101 items tracked by the PBS for LSM computation saw the production dip compared to same period last year. The month-on-month dip is spread even broader, but there is always an element of seasonality comparing LSM on sequential basis.
There are clear signs the large-scale industrial activity is nowhere near peaking, and the central bank’s output gap theory seems to have firm grounds. Mind you, there is still the impact of partial lockdowns in July numbers, therefore not much must be read into it. What is coming ahead in terms of inflation and monetary policy will have considerable bearing on how the LSM shapes up.
Although it has time and again reminded been by the central bank that any effort to raise the policy rate will be gradual, the commodity-driven inflation may well throw spanner in the works. The government also seems to have waited long enough for the commodity prices cycle to reverse. The petroleum prices have recently been increased, which is likely to cause a dent in overall consumption.
The overall price increase in consumer products in the past three years relative to the income – will also have an impact on consumption. Last year’s 15 percent LSM growth was well and truly an exception. It is a long way to go for FY22 – but like other things the LSM growth could also be “measured” and “gradual” this fiscal year.


Comments
Comments are closed.