

The recently released central bank’s State of Economy report on 2QFY21 touches upon the employment subject in greater detail, continuing with the trend started from the previous version, and for good reason too. The employment landscape has undoubtedly undergone significant volatility over the past five to six quarters – as Covid related slowdown wreaked havoc across all job providing sectors. The employment trajectory since the worst period of 4QFY20 – often termed as the Corona quarter – has mirrored the broader trend in industrial growth.
The SBP report captures employment data till November 2020 in case of industrial employment. More data has arrived since, and further confirms the ascendancy trend that does not look much different from the provincial Large-Scale Manufacturing (LSM) indices.
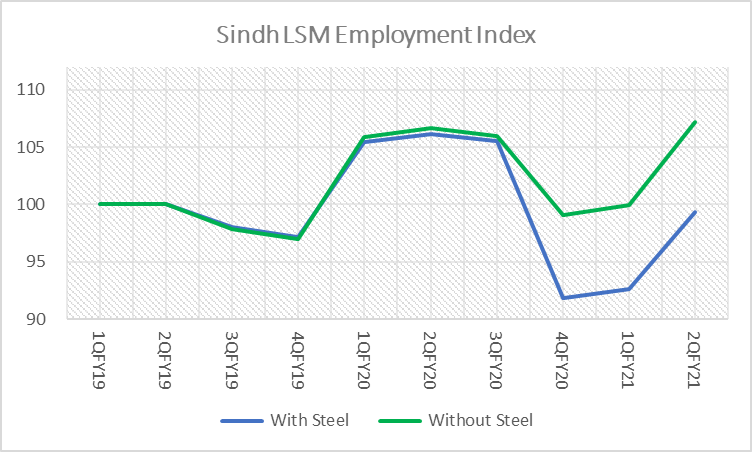
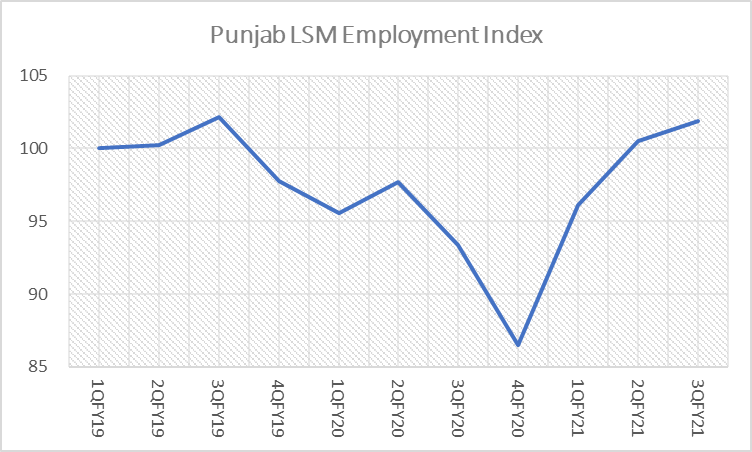
On a collective basis, the LSM Employment Index for the two big provinces Sindh and Punjab, has continued the upward trend. And if Punjab’s 3QFY21 employment index is any guide – the same for Sindh should well be in order. Sindh’s data on employment, so far only goes as far as January 2021, but the trend assures the combined index could well beat 105 from current level of 100.
This data comes with caveats and should not be confused with proportionate representation of the country’s employment landscape. Employment in industrial sector is around 24 percent of the total, but LSM’s share could well be less than one-fourth of total industrial employment, despite 40 percent share in industrial GDP composition.
The combined provincial indices are not necessarily a clear reflection of the overall employment picture in the country. Construction, retail and wholesale and other services carry significantly higher weightages, and the numbers are not recorded on time series basis as is the case with LSM. Some of the smaller scale industrial units are believed to be generally more labor intensive, and lack of formal credit puts such units at a larger risk of job losses than the bigger counterparts. All said, LSM still remains a sizeable piece of the puzzle, and working with available numbers is not all that bad an idea.
The discussion is also important as it leads to the more important question of the extent of spare capacity in the country’s economy. Employment trends are one of the many tools globally used to measure output gap in economies. The central bank too has been keeping a close eye and believes the output gap continues to remain negative, although narrowing with the passage of time.
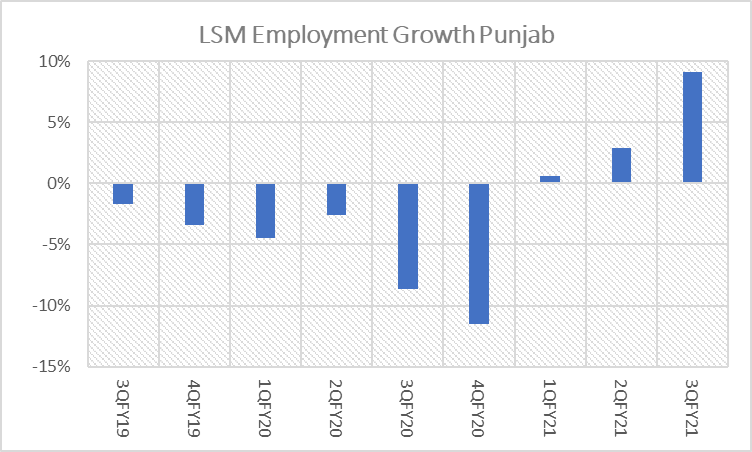
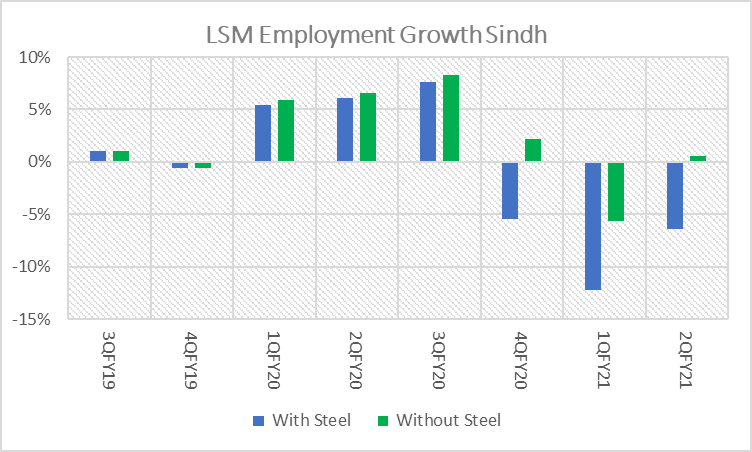
Minus the retrenchment at the Pakistan Steel Mills, jobs in Sindh have recovered faster than Punjab – and with 3QFY21 data yet to come from Sindh, it may well be even higher on 3Q comparison. The recovery is broad-based, across cotton textile, sugar, pharmaceuticals, and cement industries.
Cotton textile is 50 percent of the total employment measured by the combined index – which carries risk of over/under reporting in extreme scenarios. Moreover, textile employment captured only reflects cotton yarn and cotton cloth end of the chain. This is how it fails to capture the story that has gone around in recent months how Faisalabad was facing labor shortage. Mind you, most of the activity on export front has happened around readymade garments, knitwear, and bedwear – some of which have seen historical highs in terms of export quantities.
All in all, however unrepresentative the data may be of the entire industry, let alone the economy, it remains vital to be tracked and analyzed – as it continues to present inputs to key monetary and fiscal planning and policy decisions.


Comments
Comments are closed.