

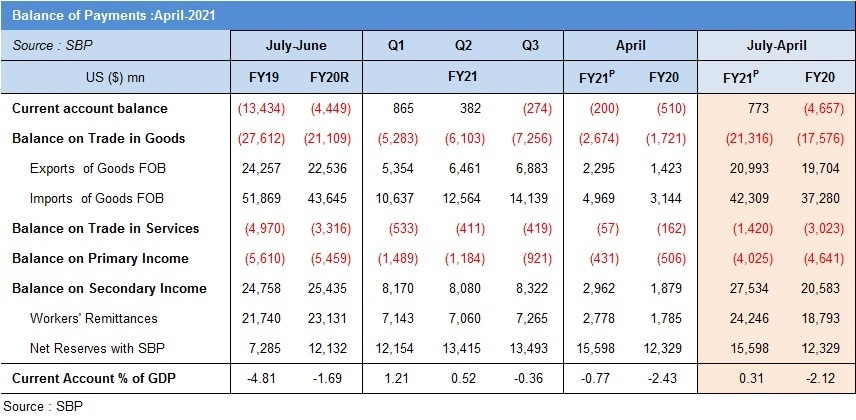
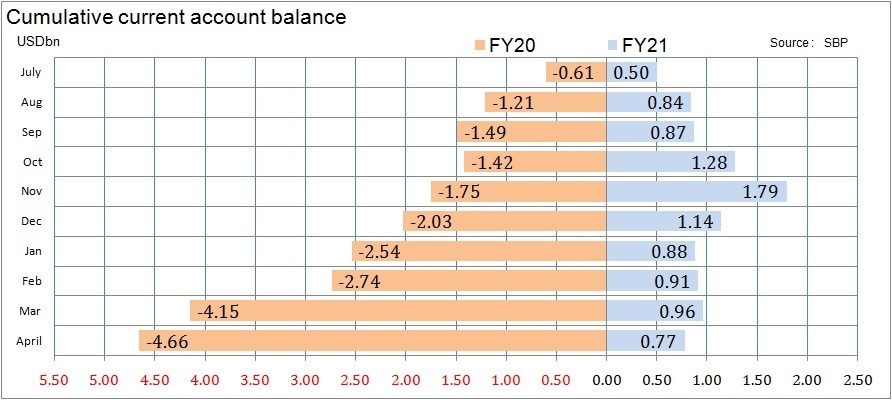
As expected, the current account deficit remained mild at $200 million in April 2021. The 10MFY21 surplus is standing at $773 million as compared to deficit of $4.7 billion in the same period last year. The full year is likely to show marginal surplus – this would be the first time the country will show surplus in 10 years. This at a time when the economy is rebounding. As mentioned by SBP, imports are picking up due to a sharp economic recovery. Thanks to factors such as less travel which boosted remittances, higher other current transfer and exports in services with a dip in services imports; the current account is looking healthy in surplus.
In numbers: the trade balance in goods worsened by 21 percent or by $3.7 billion in 10MFY21 to $21.3 billion. But the improvements in other factors- 53 percent less or $1.6 billion in services trade deficit (due to higher IT exports and less travel related ticketing and other expense in imports), 29 percent or $5.4 billion better home remittances, and 95 percent or $1.6 billion increase in other current transfer (organized charity and donations)– overall compensated the worsening of goods trade deficit. The improvement is $8.7 billion and goods trade deficit worsening is $3.7 billion. The net improvement is $4.9 billion and that is what is largely turning current account from a deficit of $4.7 billion to a surplus of $0.8 billion.
The cushion in remittances and other factors have given space to the policy makers to let imports remain higher than $5 billion (on average) for the past few months. This higher import number is reflecting in better LSM and overall GDP growth. Higher commodity prices are soaring the import bill too. This is not raising eyebrows of policy makers and that is letting them to not raise interest rates. Expect no change on Friday in the monetary policy announcement.
The growth momentum is picking up. The new FM came up with a fresh zest to boost growth further to cross 5 percent next year. Invariably, imports will pick up more. Let’s see how long this momentum will continue without taking current account deficit to noticeable, eyebrow-raising levels.
On imports
In Apr-21, imports bill stood at $4.97 billion and its down by 4.5 percent from Mar-21. Based on PBS, imports bill stood $5.26 billion during Apr and $44.8 billion in Jul-Apr – up by 17.8 percent. One of the bigger increases was in food commodities import – up 54 percent to $6.9 billion—almost a billion dollar ($983mn) of wheat in ten months which was nill in the previous year. The country imported 3.6 million tons of wheat. The new crop is bumper and latest numbers at 27.3 million tons have surprised many. If these numbers are true, the government should shelf (or significantly lower) the plan of $3-4 million imports in the upcoming season. Add around $300 million imports of sugar and apply the same argument. Savings could reach $1.3 billion. This may give room for other imports to grow.
The biggest chunk of foods imports is of palm oil – which stood at $2.1 billion in 10MFY21- up by 36 percent in dollar terms and mere 7 percent in quantity. It is one of the first items where the supply chain disruption triggered the price increase – up by whopping 75 percent (YoY) in April 21. This import bill may comedown next year as prices normalize – a couple of hundred dollars savings can create space for growth related imports provided palm oil prices show signs of ease.
Machinery imports group is the second biggest importing group (after petroleum) – up by 11.2 percent. Barring mobile phones (not machinery as such but categorized as), the machinery import bill is up by mere 2 percent to $6.2 billion. The economy is now in expansionary phase. TERF related imports will soon pick up. A few other industries are planning to expand – Engro alone is coming up with a billion-dollar petrochemical project. The machinery imports are likely to be higher next year and that’s good.
Mobile phone is becoming a category in itself – imports are up by 64 percent to $1.7 billion in 10MFY21. This will be over $2 billion for the full year. Not only has smartphone penetration grown, all the mobile phones being imported are through legal channel. In April, mobile phone imports went down by 34 percent (MoM) to $149 million. The lower number is due to less imports as COVID cases were growing in addition to a speeding up of local production. The number may remain low in May due to a higher number of holidays and may normalize to over $200 million in June.
The highest increase in imports groups is of transport group – up by 77 percent to $2.3 billion. This is evident by the launch of new cars (mainly SUVs which are expensive and have less localization) and overall uptick in the cars segment thanks to lower interest rates and low base in the previous years. The momentum is likely to continue for the next year.

The biggest importing group is petroleum. The toll stood at $8.7 billion. Interestingly, the number is down by 8 percent from the same period last year. Although, quantity imports of both petroleum products and crude are up 27 percent and 26 percent, respectively. The lower prices in the first half of the fiscal year helped keep the bill tamed. Those low prices were due to reduced travel. Now the demand is picking up and oil prices are hovering high ($60-70/barrel) for the past few months. The petroleum bill is likely to be higher next year. The decline in food (wheat and sugar) imports, however, would give space for higher petroleum imports without raising too many eyebrows.
Textile group imports picked significantly too – up by 47 percent to $3.1 billion in 10MFY21. Here the culprit is another major crop -cotton. $1.2 billion worth of raw cotton is imported in 10MFY21 – up 76 percent. This used to be almost nonexistent a couple of years back. The secular fall in cotton crop is making textile players import cotton.
Agri and other chemicals imports are growing at a decent pace and it is the third biggest import group – up 17 percent to $7.3 billion. The biggest chunk is plastic material -up 24 percent to $2.0 billion in 10MFY21. Other products in this category are up 17 percent to $3.6 billion. That is too big a number without any categorization. One of the biggest items in this perhaps is coal – which is used in power generation and manufacturing of goods, particularly cement.
Metal group is growing at 20 percent. Iron and steel (including scrap) are main items. Combining the two, $3.1 billion is the import bill in 10MFY21. Upbeat construction and automobile sectors are generating steel demand. With economic growth, like many other items, the upbeat momentum in metals will continue.
On exports
The story of exports is not that bad considering the sluggish history over the last decade. Exports are up by 13.6 percent to $20.9 billion – the toll is likely to reach $25-26 billion in FY21 – to be the highest ever goods exports of the country. Food exports almost kept unchanged at $3.7 billion in 10MFY21. This has to change. The food trade deficit for Pakistan is standing at $3.1 billion as imports are double of exports. That is not a healthy sign for an agriculture country. The government is planning to come up with an agriculture package in this budget. This must help lower the deficit.
Textile exports is the star – up 17 percent to $12.7 billion in10MFY21. Interestingly, low value-added textile exports are down. Barring cotton yarn and cloth, textile exports are up by 23 percent to $10.3 billion. Knitwear is the new king – exports in it increased by 31 percent to $3.1 billion in 10MFY21. Almost all the value-added sectors – bedwear, towel and readymade garments observed good double-digit growth. This momentum is likely to continue as many companies are in the process of expansion. With the opening of the US market, the demand is likely to jack up further.
Other manufacturing group exports are up 11 percent to $2.9 billion in 10MFY21. Sports goods numbers marginally fell (by 5%) to $218 million as fewer sporting events are taking place in the world. Engineering goods and leather products are growing fine.

Exports are picking up, but the base is too small relative to imports and any pick in imports will further worsen the trade deficit in goods. That is why it is imperative to lower food related imports to give room for growth promoting imports. And that is why the lower services trade deficit is especially important – deficit is down by 53 percent to $1.4 billion.
The star performer is IT exports - up 46 percent to $1.7 billion. Some of the increase could be due to moving proceeds to formal channel and the rest would be due to more business outsourcing (without visiting the client) during COVID. Here the potential is huge. The problem is finding trained human resource. More than half of IT graduates are from mediocre universities and not ready to compete internationally. Here, setting up training bootcamps could harness all this half-baked talent which could ultimately turn into much needed dollars for the country.
The service imports fell by 18 percent due to less travel. But with travel resuming once again, this benefit will surely wipe out. Less travel benefit is seen in other areas too. One is remittances which is by far the top savior. Some of the increase (29% or $5.4 bn in 10M or $540 mn per month) can stick around, provided those who have moved to the formal sector for the first time actually remain there. SBP and banks’ efforts to lure them is important. Another factor is that expats generally like Imran Khan. As long he remains in the good books of expats, remittances may continue to remain higher than pre Covid levels.
The story of current account is good. But on the financial accounts, market-based flows – FDI is drying up. Confidence must boost to a level where FDI starts pouring into Pakistan. Just to give perspective, Pakistan’s FDI in 10MFY21 is a mere 2 percent of what was fetched by India. This number in Pakistan must multiply in the next 2-3 years and this will give space for imports to jump and allow the economy to grow.
Nonetheless, current account surplus and debt-based flows are helping reserves to grow. SBP foreign reserves are up by $3.2 billion to $15.8 billion while the current account surplus was mere $773 million. SBP should aim for reserves to reach $20 billion by calendar year. Without a battery of reserves, growth momentum would be short-lived.


Comments
Comments are closed.