 The trade deficit continues to improve, as the provisional trade numbers released by the PBS suggest a 33 percent year-on-year improvement during 4MFY20. The import compression story has been building for quite some time, and is the chief reason why current account deficit has come down to where it has. The bigger picture, so to speak, had already started emerging more than a year ago.
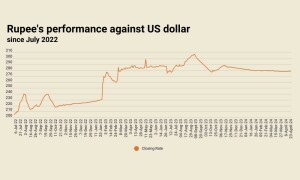
Much debate has surrounded exports, and rightly so too. Recall that the massive rupee depreciation drive last year resulted in many asking for a more visible growth in exports, which never arrived. Those at the helm had underpinned “lag effect” with the hopes pinned at revival by January-March 2019. It did not happen. Exports mostly stayed flat in value terms.
But October 2019 provisional numbers should instill hope. There is no such thing as a psychological barrier in export values, but October 2019 is the first October since at least FY13, where exports have crossed the $2 billion mark. October has traditionally set the tone for Christmas and New Year export orders. Almost every single time, November and December exports have exceeded that of October – which is a very healthy sign for 2QFY20 exports – and the growth could well increase from a miniscule 3.8 percent to healthier ranges.

The quality within export had already started to improve, as evident from substantial volumetric increase in a number of key exporting categories. The heart line of Pakistan’s exports, textile has seen decent growth – especially in value added segment, witnessing volumetric growth even to the tune of 40 percent. The pattern signifies that the government’s export support packages in terms of reduced energy pricing and better financing availability, have played a role in keeping the exporters afloat.
The exportable surplus could be built further as expansions are underway in a few sectors. The volumetric growth is heartening and will eventually result in better value as well. Unit prices may not increase overnight, given the overall global economic slowdown, and the global commodity price trend too suggests, prices may not increase anytime soon. Pakistan still stands to gain in terms of reduced cost of labour to compete for a bigger share of a likely-shrinking pie.


Comments
Comments are closed.