 Pulses constitute of as much weight as onions in the Pakistani food consumption basket, as measured by the Pakistan Bureau of Statistics (PBS). While onions make the most headlines, when it comes to prices, things still even out, when spread over the year – apart from the seasonal hiccups, being perishable. Pulses largely go unnoticed, being non-perishable. If you are one of those Jodia Bazar traders – it is highly likely you have made decent margins in the past few months.
Pakistan imports bulk of the pulse, Gram being the country’s chief pulse produce, followed by Moong. Pulse imports have averaged near a million tons per annum since FY16, constituting nearly two-third of the country’s demand. Pakistan’s lentils production, including Gram (all of which is not used as pulse) has averaged around half a million tons in the last five years, with FY19 recording the highest production at 0.57 million tons.
Of all the lentils, Gram is the most produced in Pakistan, with the least imports, as the production stood at nearly 0.4 million tons in FY19. Incidentally, Gram pulse is also the most stable in terms of price fluctuation, as the price has largely remained flat for over two years.
Meanwhile, the average per unit import price of pulses has halved in the last two years. Import price per ton for lentils in July 2019 was $908 per ton, which came down to $455 per ton, as per the latest data for August 2019. But the lentils’ prices at home, for both Mash and Moong have rapidly increased in the last 12 months.
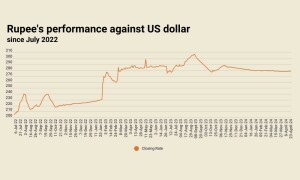
The rupee meanwhile shed nearly 30 percent of its value, whereas Moong and Mash have gone dearer by 49 percent and 30 percent, respectively.
Even after accounting for the change in dollar value, the import parity price for lentils at Rs72 per kg in July 2019 was the lowest in over three years.
While some of the increase in Mash pulse is understandable, given the steep rupee depreciation, the same in Moong pulse defies logic. Remember that Moong is by and large produced at home, yet it witnessed the sharpest retail price increase.
This indicates that the traders have gladly compensated for a few lean months between July-October 2018. The lentil price in international market is at a multiyear low and the rupee has found stability. Will this also translate into reversal in lentils prices at home? Have the traders had enough of the good margins?


Comments
Comments are closed.